Today we will talk about one of my favorite tools in Azure and Azure Governance in particular. That is the Azure Resource Graph and utilizing the Kusto Query Language (KQL).
Using Resource Graph Explorer is a way to discover and report on your Azure Resources. It allows you to interact directly with the Azure Resource Manager (ARM) API. We can utilize the full power of the KQL and perform efficient resource exploration at scale across multiple subscriptions. And the best part is that we don’t need to install any agent. Azure Resource Graph is used by Azure Portal search bar and All resources listing. Azure Resource Manager “informs” Resource Graph every time the change is made and the database is updated immediately.
But how is that different from using tools such as Resource Explorer or resources.azure.com ? These are great tools. You can navigate to the individual resources and find the JSON configuration for that resource. Or even enable Read-Write view, and execute REST API operations from there.
The Azure Resource Graph Explorer allows you to work with data more efficiently and to create reports and dashboards. That helps with having a good understanding of what we currently have running in our Azure subscriptions and for what we are paying. It can also be used to track changes in our Azure Resources. Azure Resource Graph is much faster and more efficient than PowerShell or Azure CLI, and we don’t have to install or manage any solutions or agents.
Azure Portal:

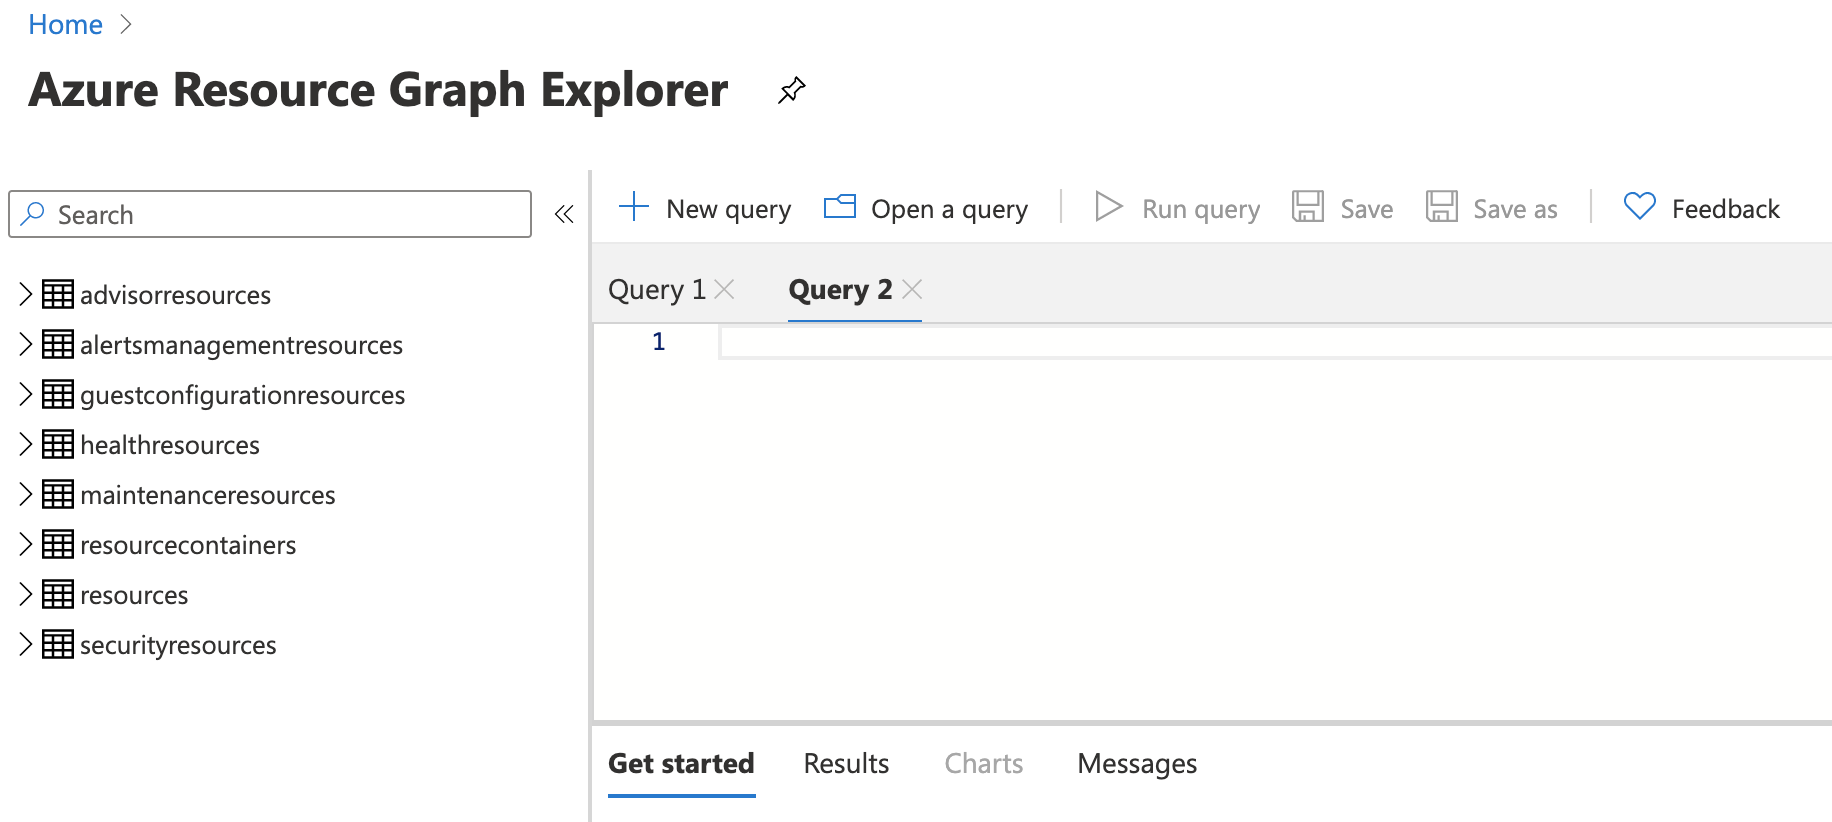
If you’ve used KQL with Azure Log Analytics, you will be familiar with this workflow and the language itself. What is different here is the schema is based on virtual tables, and we have to make our queries work with that.
These allow you to work with alert related data, drill into subscriptions and resource groups, look into guest configurations or security resources. The table that we will be working with is Resources. It contains a massive list of virtual tables that correspond to all the different resource providers, whether we are actually using them or not.
Using the interface is very simple, and it all happens in the Azure Portal.
It is a multi-query interface. If you click a New query, it will open a new query tab. As you start clicking, it will automatically start building your query. It also supports IntelliSense code completion.
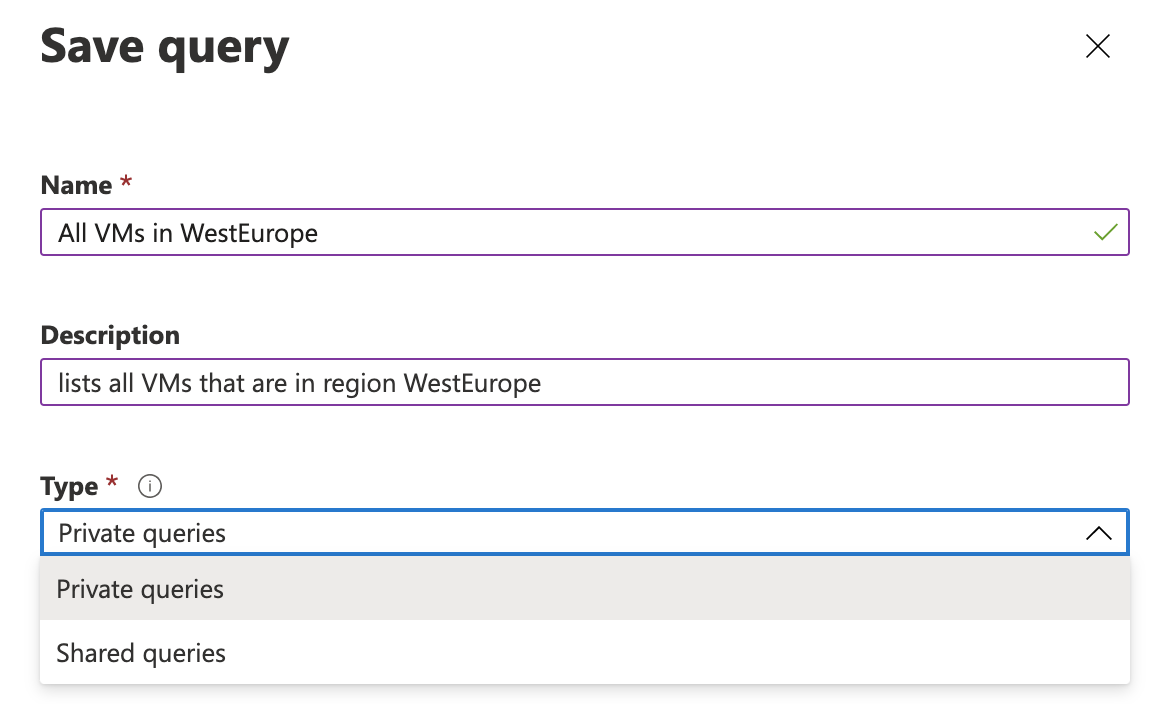
You can save your queries and share them with your colleagues. To do that, click Save or Save As. When selecting, you can save your query as a Private or Shared. The private query will keep it just for the current user, where the Shared query option will allow you to save it to the specific Resource Group. To find all Resource Graph queries available to you, you can use the Resource Graph queries view.
Command Line:
Resource Graph can also be used from the command line. Queries will work in exactly the same way and you don’t need to change them.
PowerShell
To use it with PowerShell, you need to install module Az.ResourceGraph. That is not part of the AZ module, and you need to get it separately.
1
Install-Module -Name Az.ResourceGraph
After that, you can get the list of available commands:
1
Get-Command -Module 'Az.ResourceGraph' -CommandType 'Cmdlet'
For more information, take a look at this DOCs page.
Azure CLI
To use Azure Resource Graph with Azure CLI, you first need to install extension. Extensions in CLI are something like Modules in PowerShell.
1
az extension add --name resource-graph
Here is how to get help on running Graph queries:
1
az graph query -h
For more information, take a look at this DOCs page.
RBAC
Now that you are familiar with the interface and you know how to run the queries, you need just one more important thing to keep on your mind before we can start exploring.
Please note that RBAC is in play here. The user who is running queries will only get the results for what is allowed by RBAC. I often hear the complaint that the query didn’t list all the resources in subscriptions, and in most cases, the user didn’t have access to it.
First queries
The first example to try out is to target the Resources table and find out how many resources in our subscription we have.
That query will look like this:
1
2
Resources
| summarize count()
This command can return thousands of resources. If you are interested in a specific type of resources, such as the VMs, you can filter it like this:
1
2
3
Resources
| where type =~ 'Microsoft.Compute/virtualMachines'
| summarize count()
Here is how you can do that with PowerShell:
1
Search-AzGraph -Query "Resources | where type =~ 'Microsoft.Compute/virtualMachines' | summarize count()"
Now let’s say that I am interested in finding more information about the OS types. I can find all VMs and sort it by OS name like this:
1
2
3
Resources
| where type =~ 'Microsoft.Compute/virtualMachines'
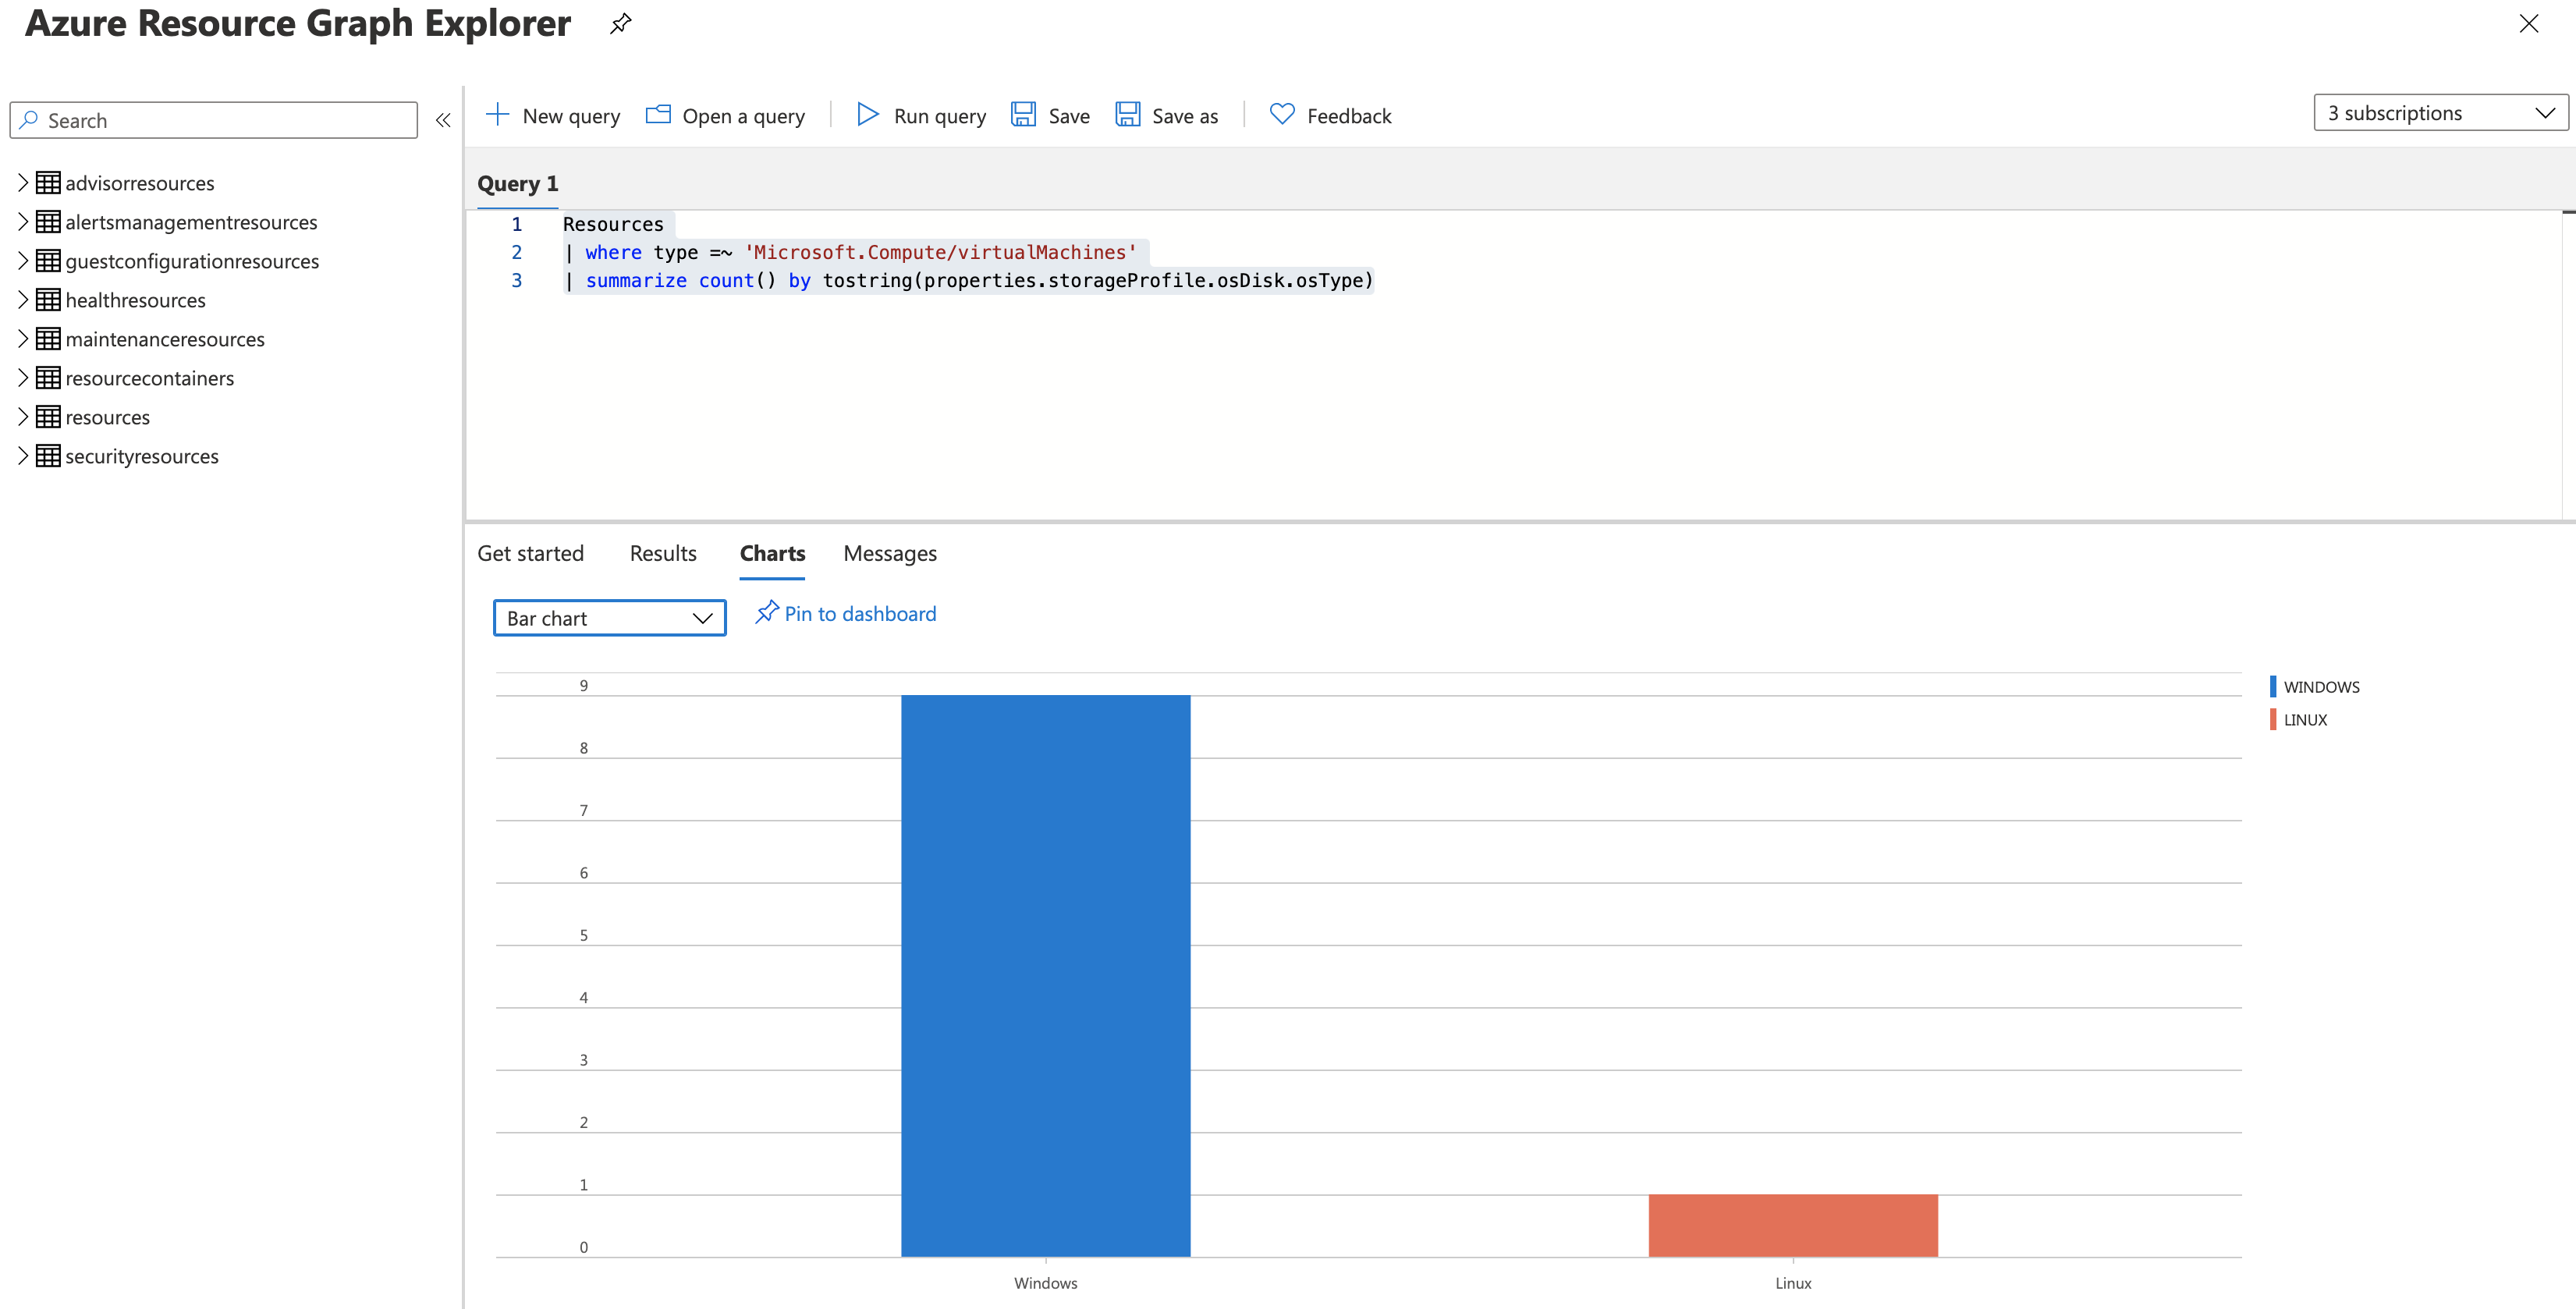
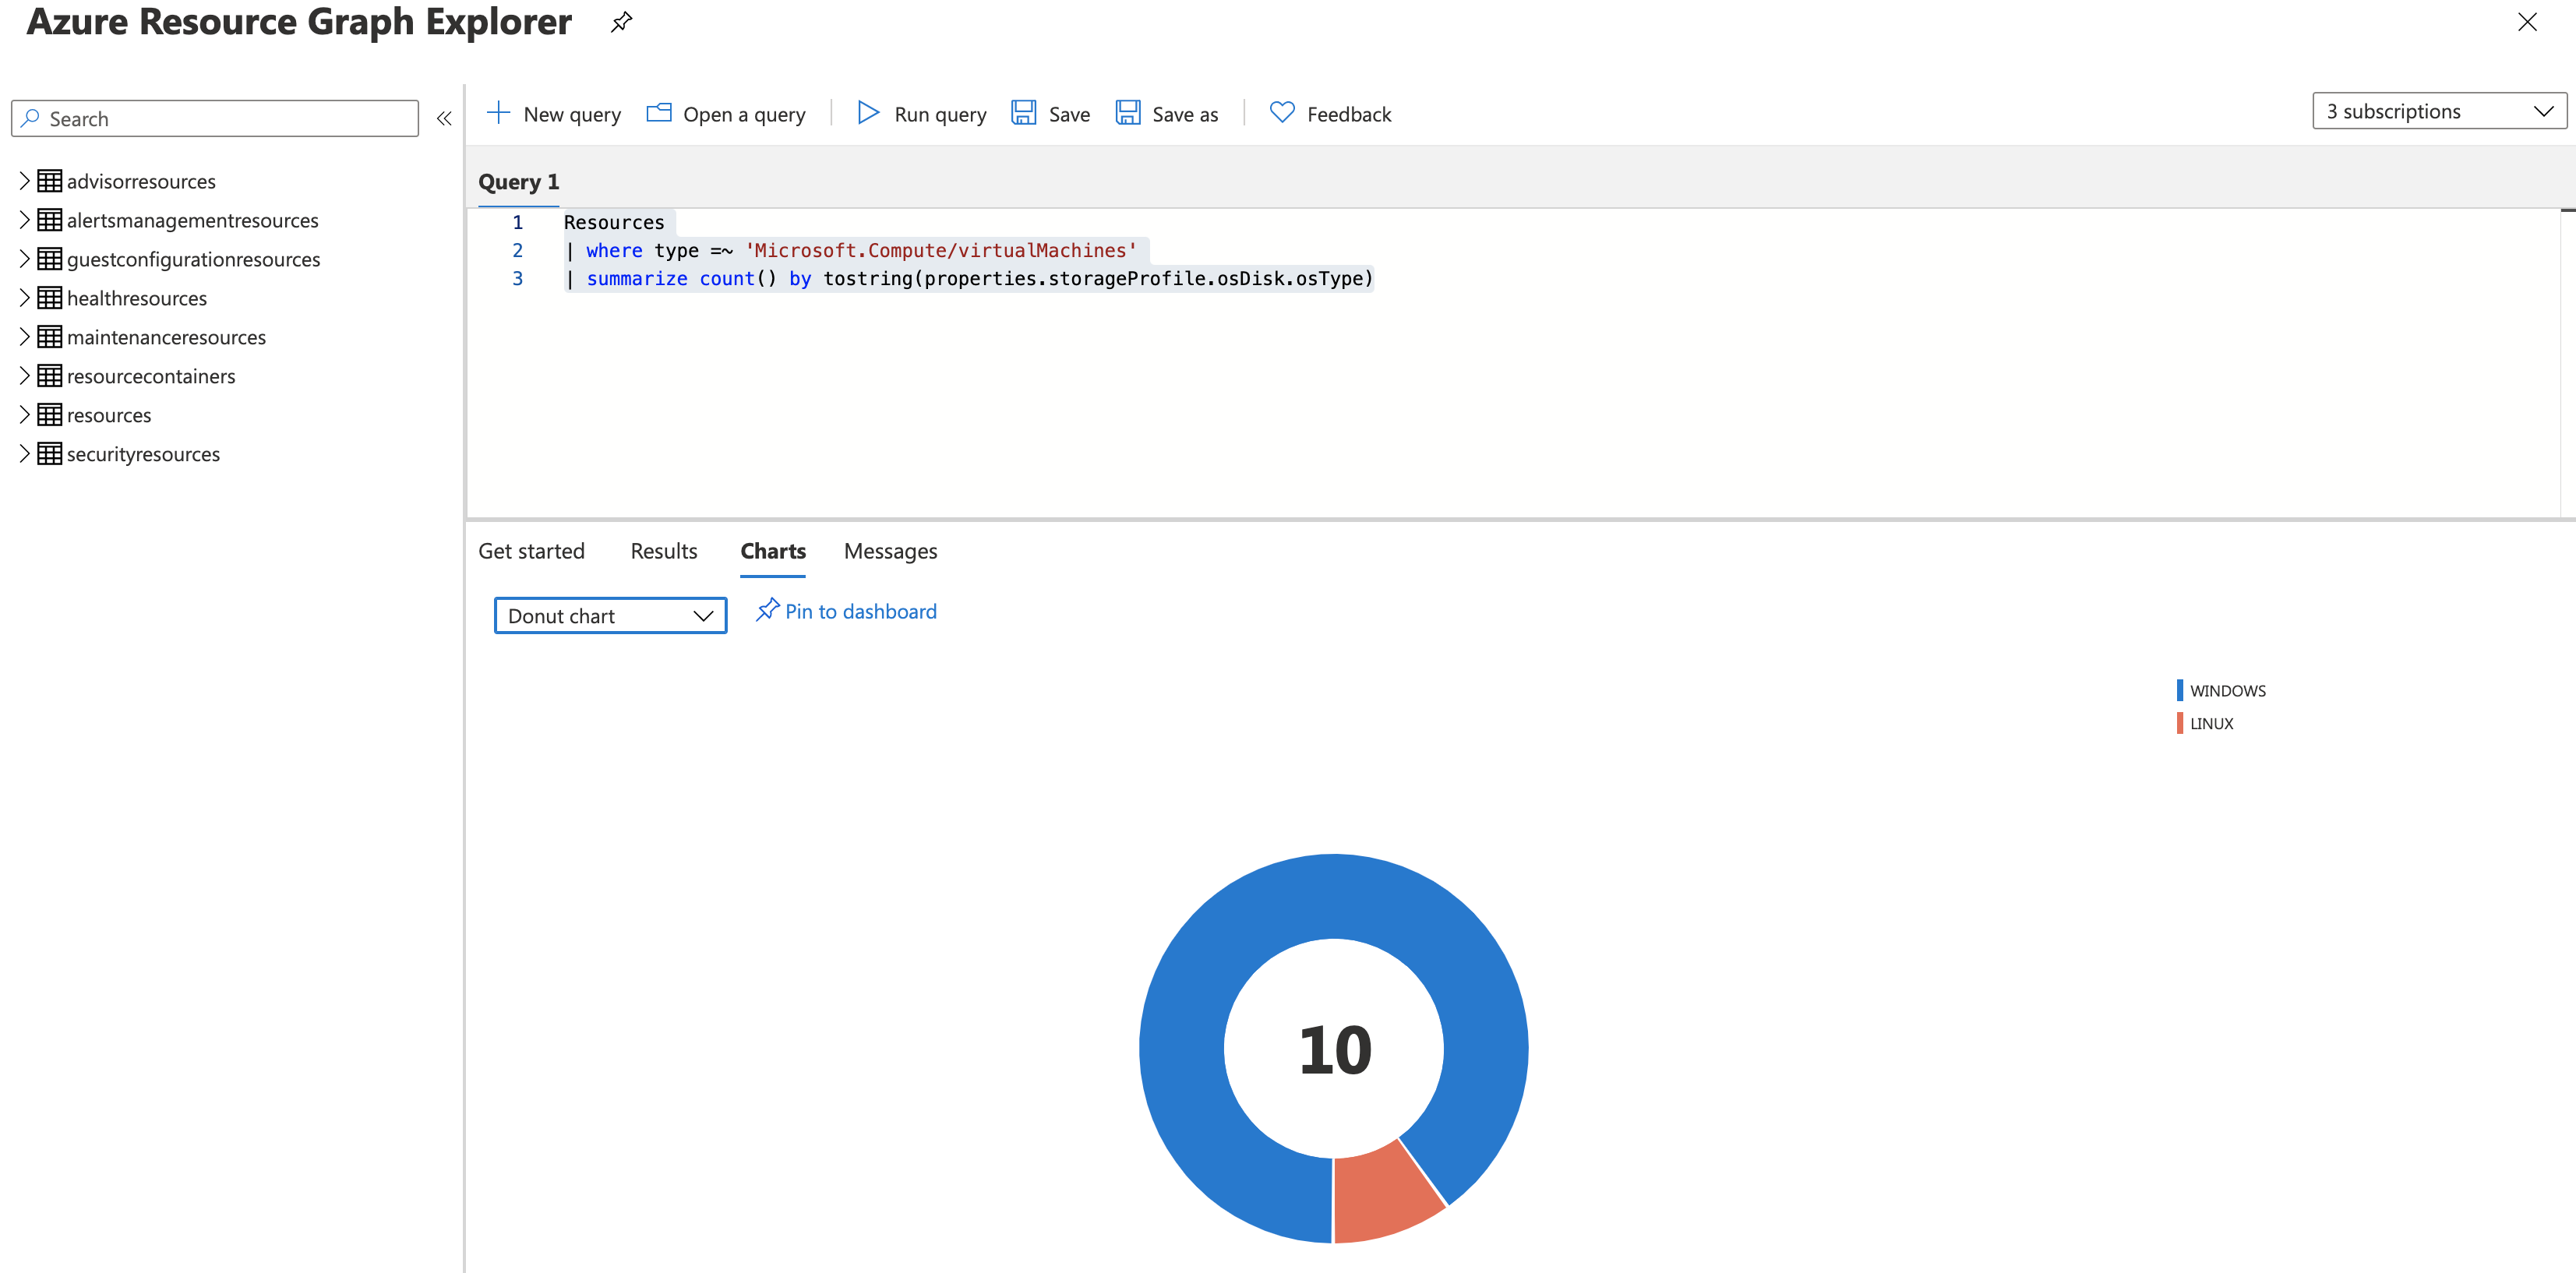
| summarize count() by tostring(properties.storageProfile.osDisk.osType)
Results
As you can see on the screenshot below, it only took 0.5 seconds to return the result. Using PowerShell would be much much longer, and that will also depend on how many VMs we have.
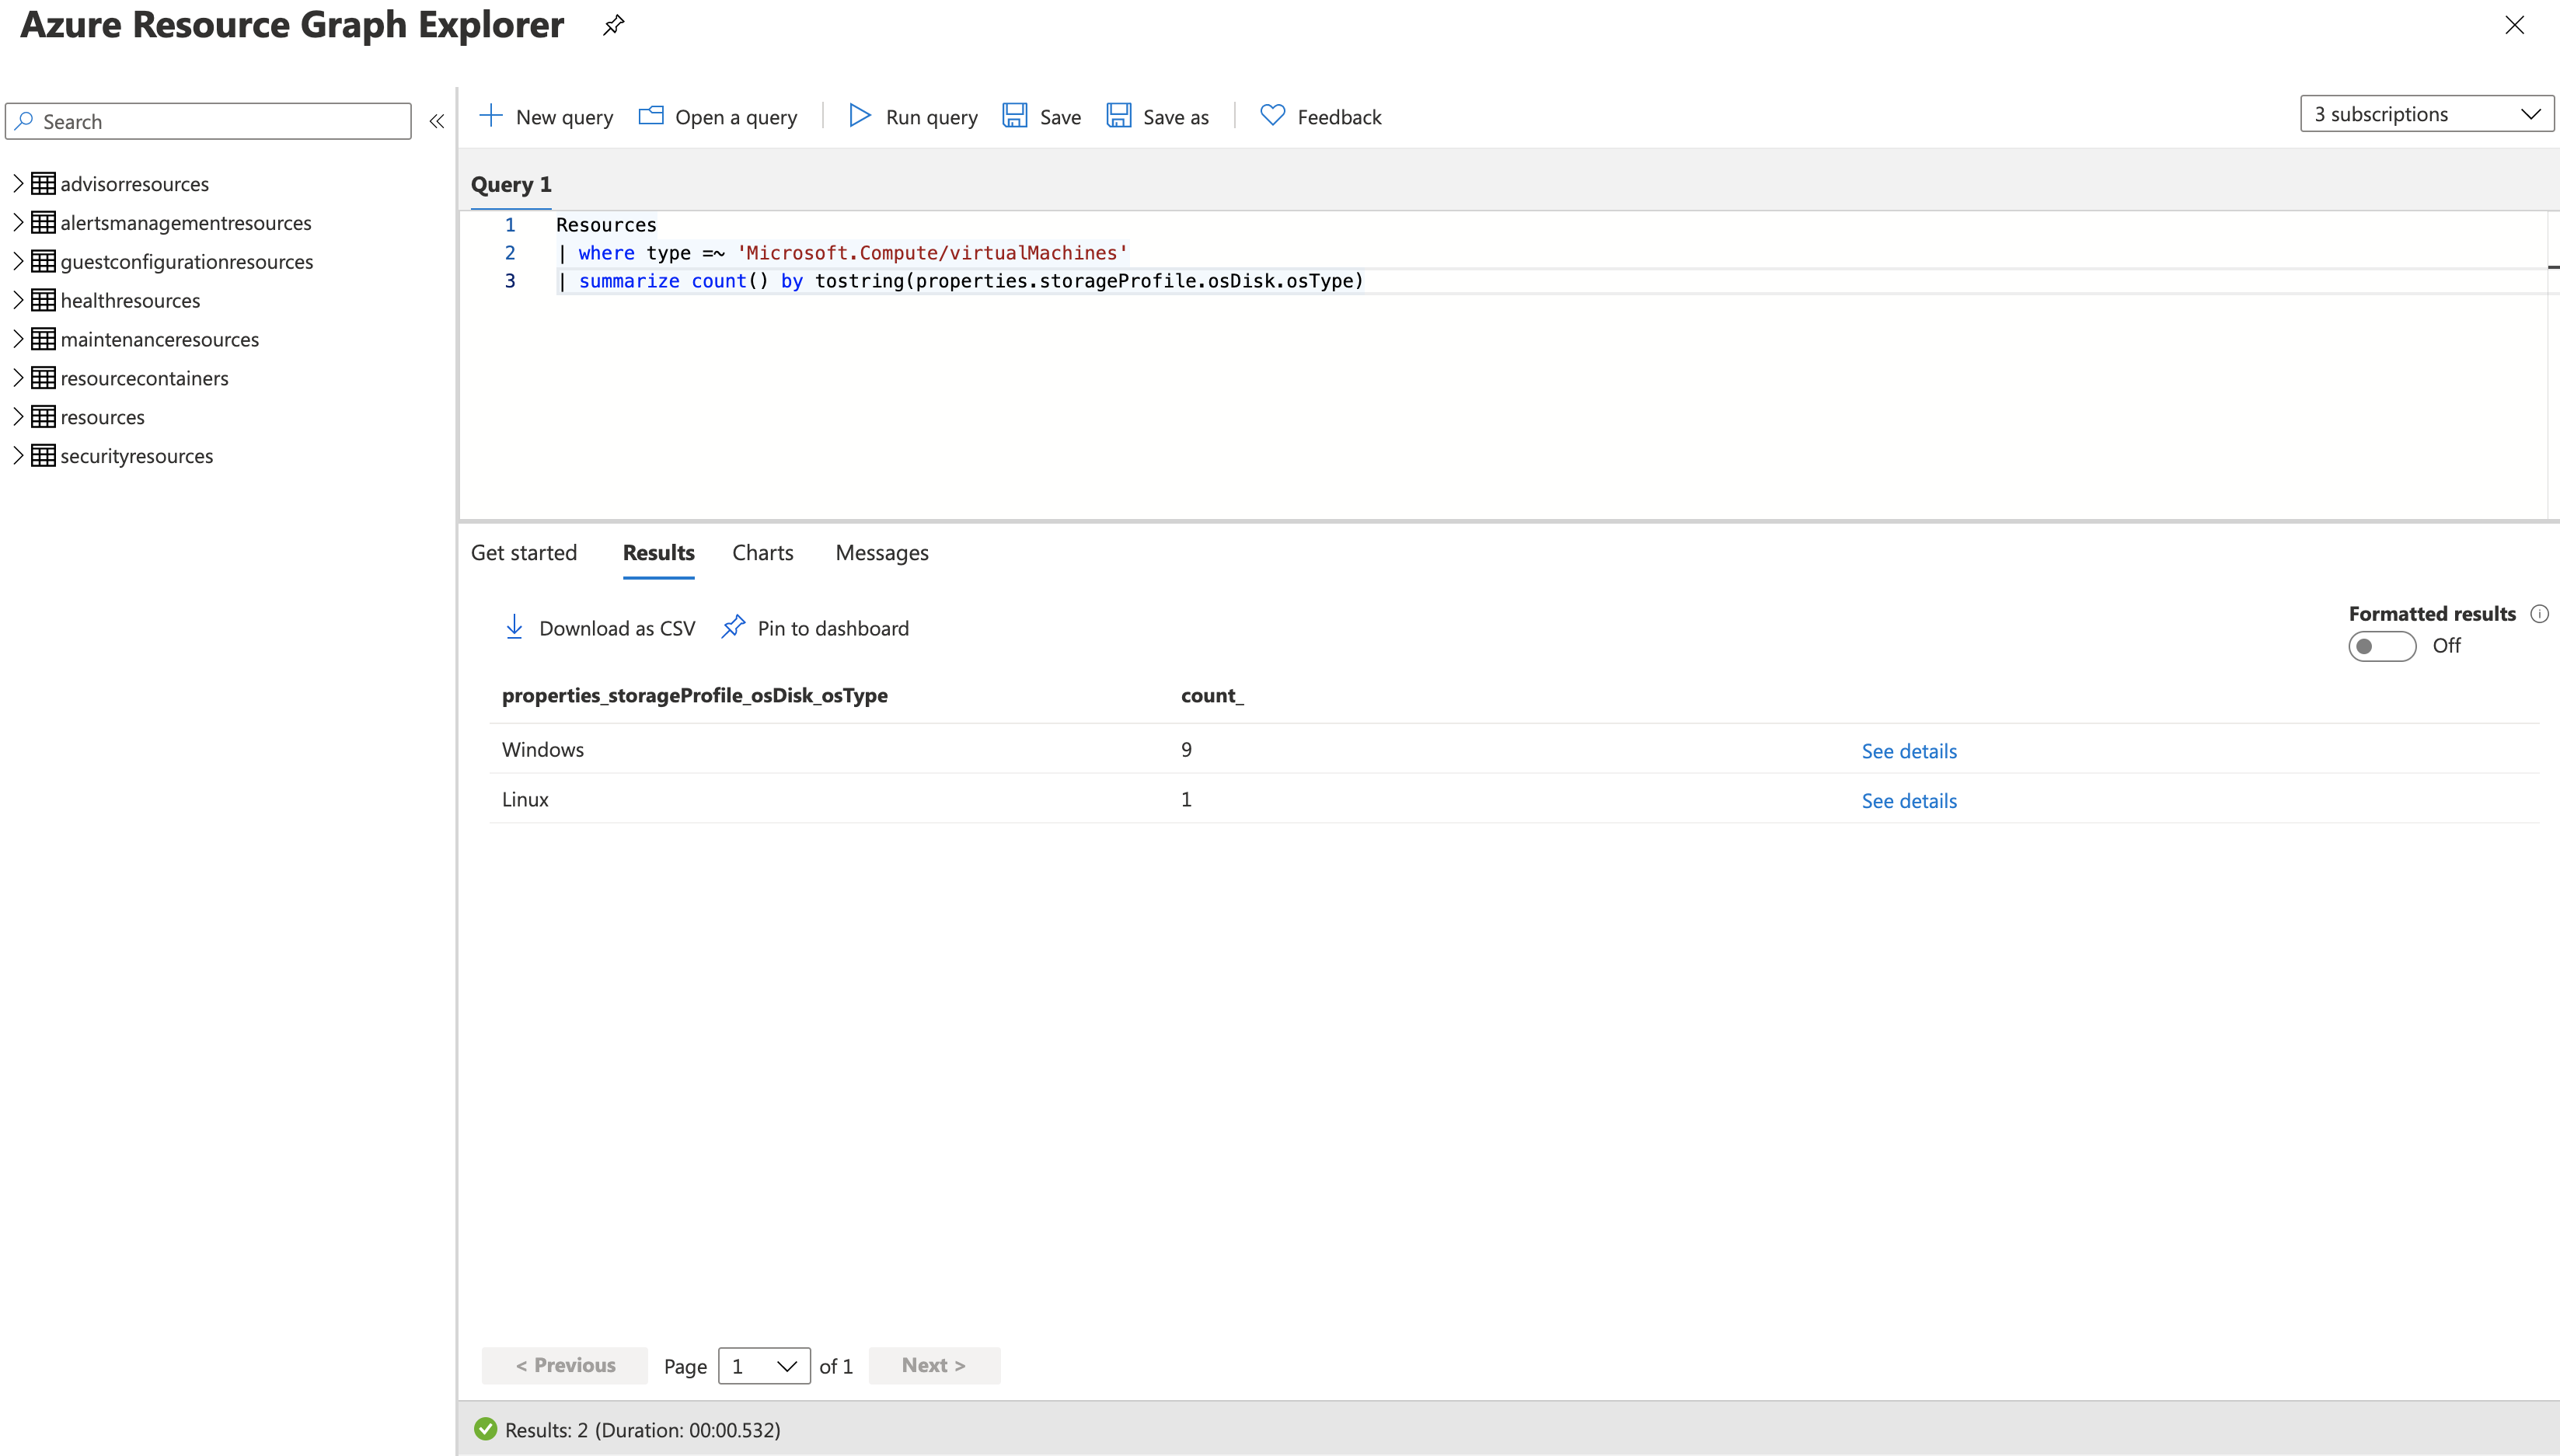
This result can be downloaded as CSV.
When you get the results, you can see it as a table. That can be the best view if you are listing specific resources or looking for properties. To make it easier to visualize large amounts of data, you can also use graphical representation and create charts and graphs.
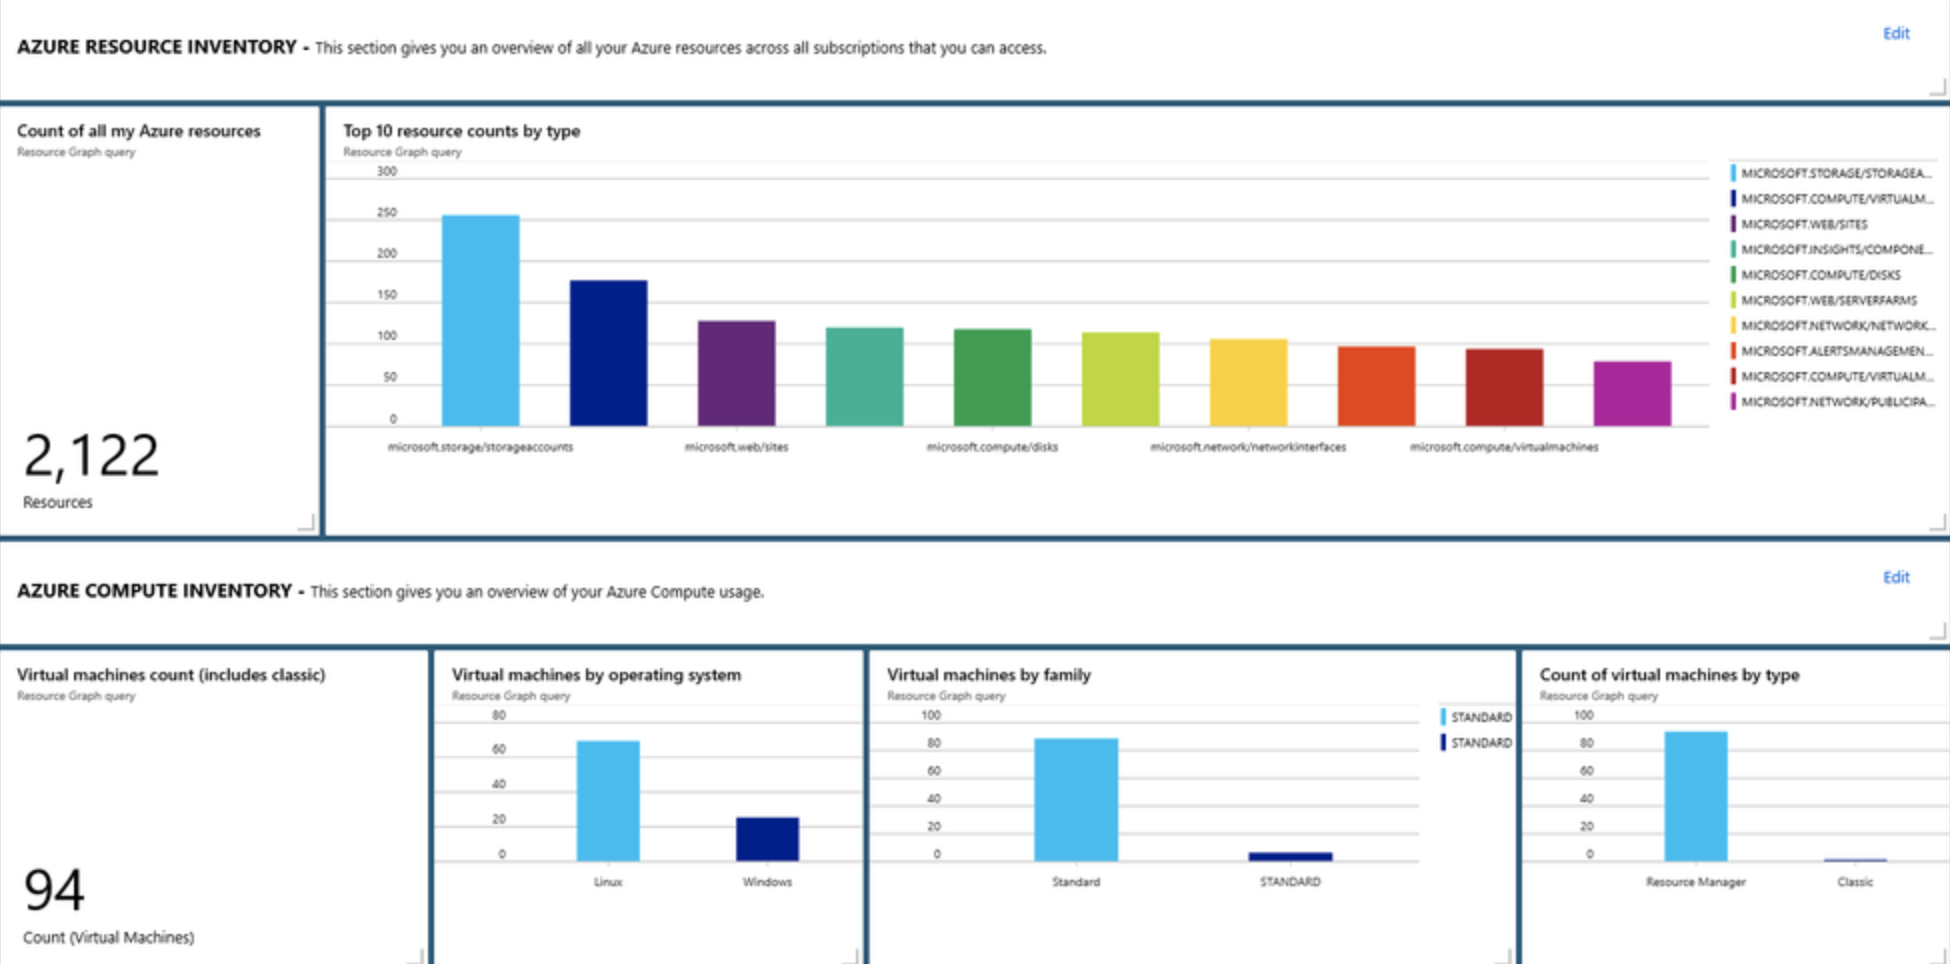
Queries and their results can be pinned to the dashboard. This allows you to create a custom dashboard that is automatically populated with all sorts of data that are displayed in real-time and refreshed every time the dashboard is refreshed. I really like that functionality, and i use it all the time.
I found a Kusto Query Language very easy to learn. But the best part is that you don’t need to know it before you can start using it. There are many examples available, and these are more than enough for the beginning.
You can find the list of Starter Queries, and some more Advanced Queries.
All Resources
Another place in Azure Portal, where you can utilize the Resource Graph’s speed, is All resources view. This allows you to list and filter your resources, to group them, or to show it as a chart or map in a summary view. Some times this can be enough for a quick overview without the need to write a query.

I hope this was enough to make you start exploring the Azure Resource Graph Explorer and learning more about it.
Azure Back To School
This blog post is part of the first annual Azure Back to School series, organized by Dwayne Natwick. If you are not already familiar with this great community initiative, make sure you check it out for a new fresh Azure related article or video every day of September.
In case you have any questions or need help with learning Kusto, feel free to get in touch.
Vukašin
