
Why do we need custom data ingestion?
There are multiple tools and ways to collect and ingest data into Log Analytics. We can collect logs, metrics, and diagnostics via Azure Monitor, security logs via Sentinel, etc. But sometimes, we find that this is either not enough, or it’s too much and we only need some of it.
Sometimes, the most important signal for your environment isn’t inside an Azure service. It can be:
- a custom scan that you run every day,
- a custom application log,
- or even something as simple—but important—as an Azure tag assigned to your VM.
Here are some real-world examples:
Here are some real-world examples of when pushing custom data makes sense:
- You want to setup different monitoring based on the Environment tag across all your VMs, but it doesn’t exist in built-in Azure Monitor tables like InsightsMetrics. You need to collect and push it manually.
- You’re running a custom script or scan across subscriptions. For example, checking expiring certificates, looking for insecure configurations, or inventorying exposed public IPs—and you want to store and query those results in Log Analytics.
- Your app produces logs outside of Azure Monitor integration. Maybe it logs to a file or emits structured JSON that you want to ingest, alert on, and join with other logs.
- Your app produces too many logs and ingesting it all creates unnecessary cost, and Data Processing Rule can’t handle it.
- Another example of this is described in an article I wrote about how to monitor available free IPs in your VNets to avoid subnet exhaustion during new deployments. Azure doesn’t give you a built-in way to track this, but you can script it and push the result into a custom table. Example of such script, and monitoring configuraiton is in article
Monitor Free IPs in Azure Subnets.
Benefits?
Once that custom data lands in a Log Analytics table:
- You can query it with KQL
- Build dashboards around it
- Set alerts using Azure Monitor rules
- And join it with other built-in tables like InsightsMetrics, Heartbeat, or ActivityLog
This lets you build a true monitoring pipeline, based not just on what Azure gives you, but on what you decide is important.
That’s the point: Azure Monitor becomes your monitor. It watches what you tell it to.
Solution Workflow
Here is the basic worklfow of what we are going to build today:
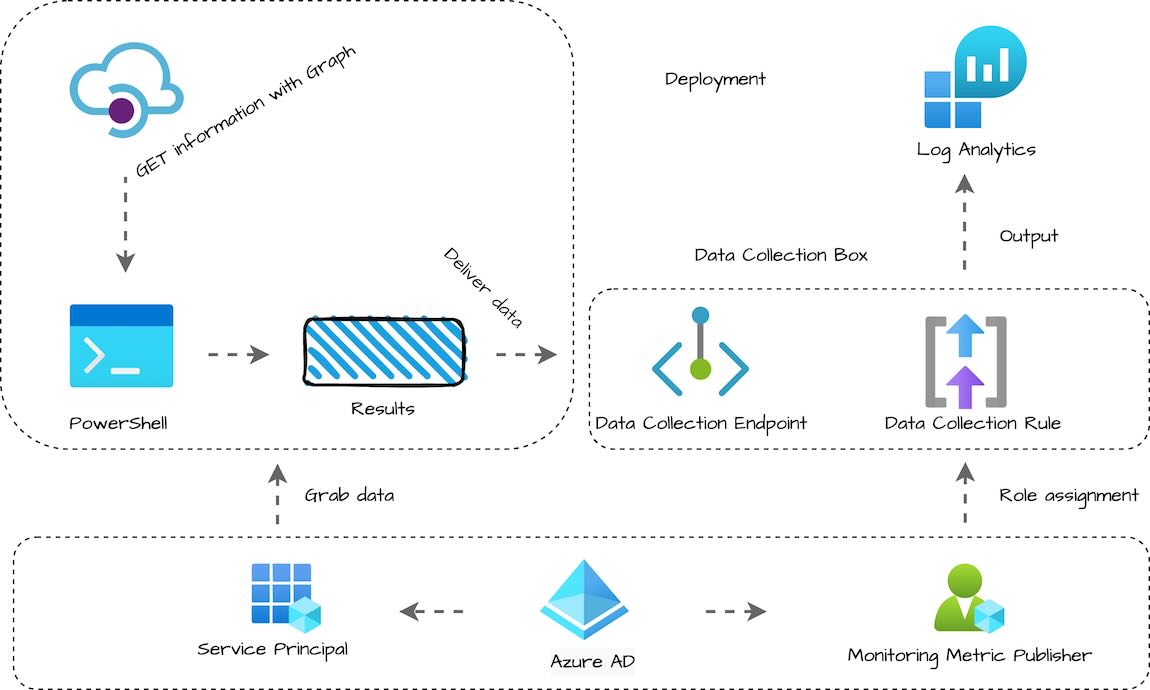
Solution relies on low-cost components and it is fully automated.
- PowerShell Script: Collects data (e.g. VM tags, scan results)
- Azure Automation Runbook: Executes the script serverlessly on schedule
- Data Collection Endpoint (DCE): Secure HTTP endpoint to receive data
- Data Collection Rule (DCR): Maps and routes data to the correct table
- Log Analytics Workspace (LAW) + Custom Table: Stores the ingested data
- KQL Queries: Used to analyze and visualize the custom data
- Azure Monitor Alerts: Triggered based on query results
Setting up the environment
In our example, we already have VM Insights enabled for all VMs. However, we want to be able to set different Azure Monitor Alerts for prod and non-prod VMs. To do that, we are going to do the following:
- Collect Enviroinment tag values from all VMs via PowerShell script that is running in Automation Account
- Use the same script to ingest Tag data into the custom table in Log Analytics Workspace
- Create KQL query to join VM Insights data with our custom table by VM Name, and select only VMs with Enviroinment tag set to Production
- We can then use that KQL query inside Alert rule definition (that part will not be covered in this article)
Step 1: Create a Log Analytics workspace
Before we can store any custom data, we need a place for it to land. That place is a Log Analytics Workspace (LAW). If you already have existing LAW that is suitable for this test, feel free to use that one instead.
You can create one in the Azure Portal or via PowerShell. Here’s how both work:
- Go to the Azure Portal
- In the search bar, type “Log Analytics workspaces”
- Click “+ Create”
- Fill in the following fields:
- Subscription: Choose your target subscription
- Resource Group: Select an existing group or create a new one
- Name: For example,
law-monitoring-dev - Region: Match the region of your automation or resources
- Click Review + Create → Create
Your workspace is now ready to receive custom data. That’s it. You now have a workspace where you can store custom data.
If you prefer automation or are deploying via scripts, here’s the same thing in PowerShell:
1
2
3
4
5
6
7
8
9
10
11
12
13
14
15
16
17
18
# Login to Azure if needed
Connect-AzAccount

# Set target variables
$workspaceParams = @{
    ResourceGroupName = "rg-monitoring-dev"
    Location           = "WestUS3"
    Name               = "law-monitoring-dev"
    Sku                = "PerGB2018"
}

# Create the resource group if it doesn't exist
if (-not (Get-AzResourceGroup -Name $workspaceParams.ResourceGroupName -ErrorAction SilentlyContinue)) {
    New-AzResourceGroup -Name $workspaceParams.ResourceGroupName -Location $workspaceParams.Location
}

# Create Log Analytics Workspace
New-AzOperationalInsightsWorkspace @workspaceParams
Step 2: Create Data Collection Endpoint (DCE)
Now that your Log Analytics workspace is ready, we need to set up the infrastructure to receive custom data.
Azure Monitor’s modern pipeline separates how data is ingested (via an endpoint) from how it’s processed and stored (via a rule).
For now, we are just going to create one Data Collection Endpoint (DCE) – the secure HTTPS ingestion point.
Here is how to create DCE:
- Go to the Azure Portal.
- Search for “Data Collection Endpoints”
- Click + Create
- Fill in:
- Name: e.g.
dce-custom-monitoring - Region: must match or be close to Automation
- Resource Group: same as your LAW or Automation
- Name: e.g.
- Click Review + Create → Create
Once it’s created, copy the Log Ingestion URI. You’ll need it in your script later.
Or PowerShell method:
1
2
3
4
5
6
7
8
9
10
11
12
13
# Create Data Collection Endpoint (DCE)
$dceParams = @{
    Name              = "dce-custom-monitoring"
    Location          = "WestUS3"
    ResourceGroupName = "rg-monitoring-dev"
    NetworkAclsPublicNetworkAccess = "Enabled"
}

New-AzDataCollectionEndpoint @dceParams

# Obtain Log Ingestion URI and copy it to clipboard:
$dce = Get-AzDataCollectionEndpoint -ResourceGroupName $dceParams.ResourceGroupName -Name $dceParams.Name
$dce.LogIngestionEndpoint | clip
To keep things simple in our example, we do not need to configure any additional settings, such as Data Sources or Destinations, from here. We will associate it with our custom table and DCE in next step.
Step 3: Create your custom LAW Table and Data Collection Rule (DCR)
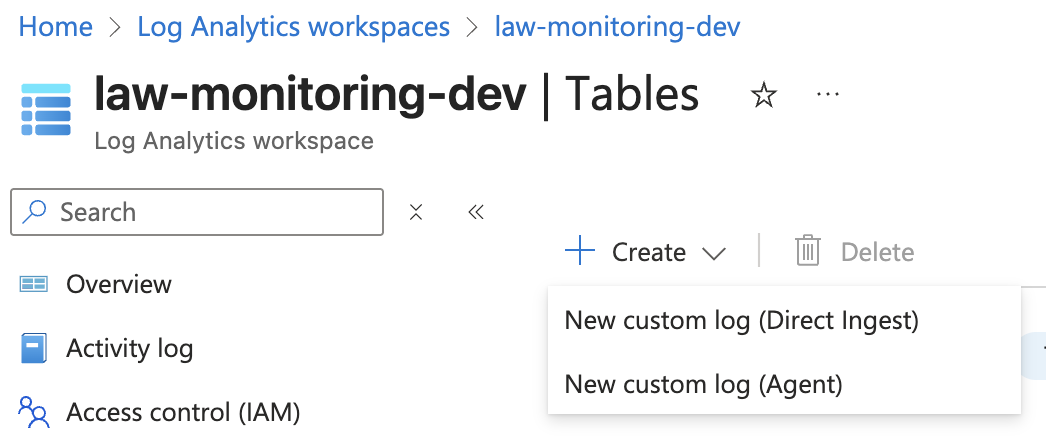
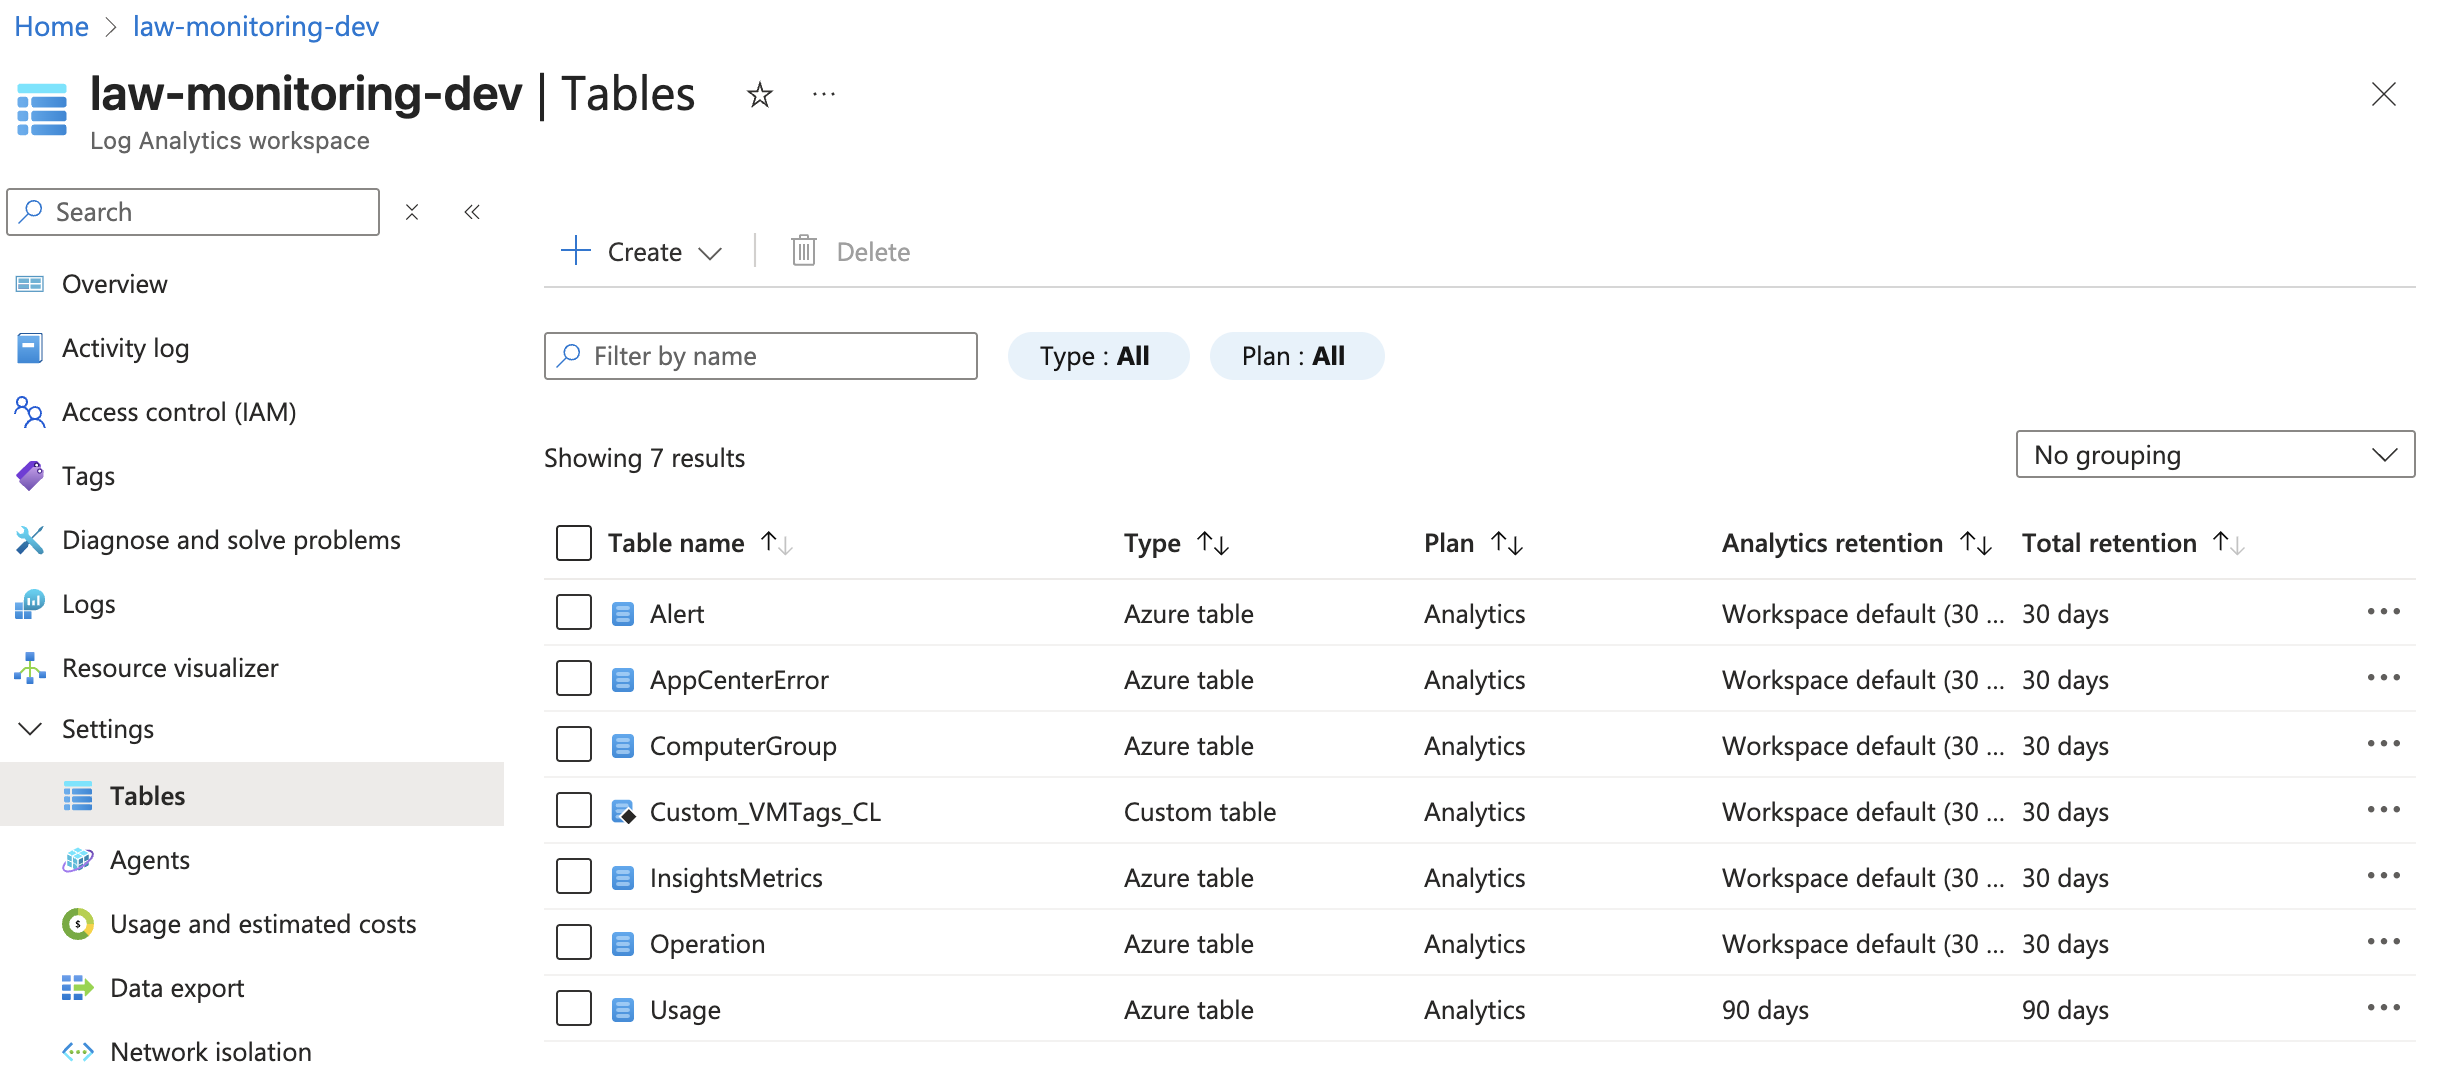
- Click on your Log Analytics Workspace and select Tables
- Click Create and select New Custom log (Direct Ingest) option. Until recently, those options were called DCR and MMA instead. Direct Ingest is a replacement for DCR option.
- Give your table a name and description
- Select the table plan that best suits your scenario. More information about it can be found on this Table Plans page.
- Since we did not our DCR before, click Create a new data collection rule first
- Fill in your
- Name: e.g.
dcr-tag-ingestion - Resource Group: same as before
- Region will be pre-selected
- Name: e.g.
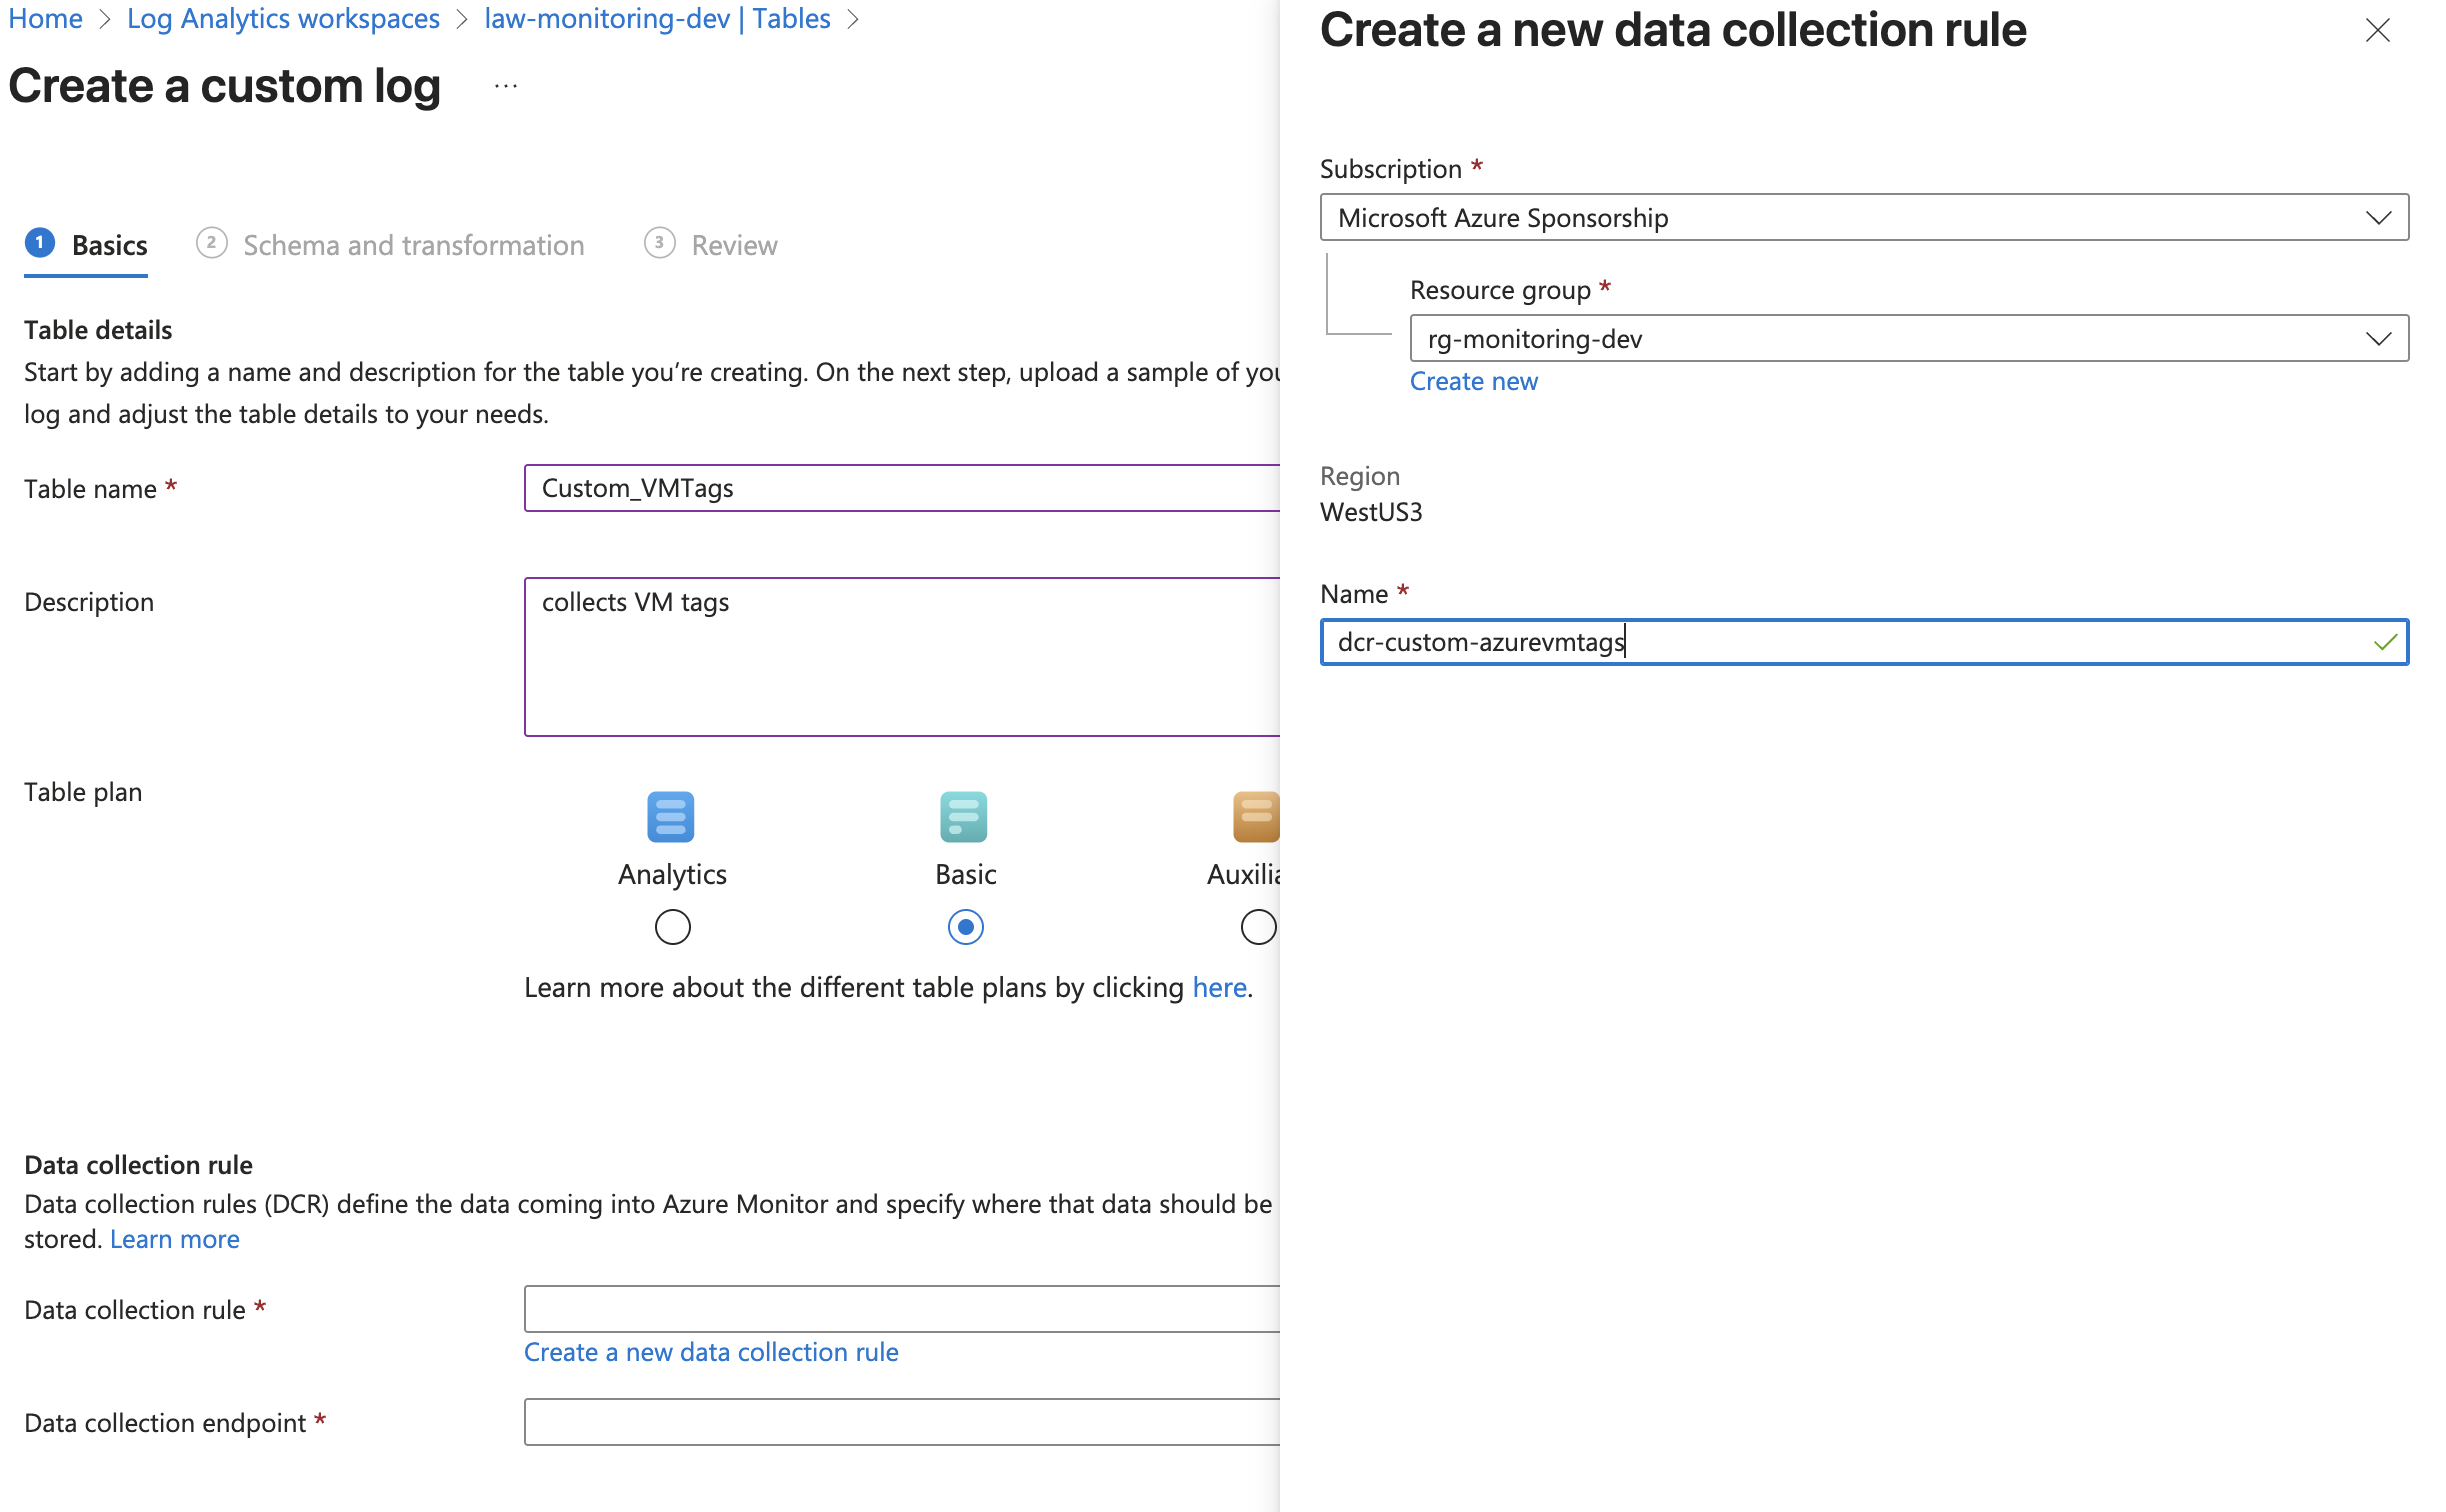
- Select DCE we created previously
- Click Next
On the next page, we need to define our schema and transformation if required. If we created DCR directly, we would be able to define this in GUI. On this page, we need to upload the sample file. This will depend on your custom script output. Our script collects the following data:
1
2
3
4
5
6
7
8
$vmData = @{
            Subscription = $sub.Name
            ResourceGroup = $vm.ResourceGroupName
            VMName = $vm.Name
            Region = $vm.Location
            Environment = $envTag
            TimeGenerated = (Get-Date).ToUniversalTime().ToString("o")
        }
So I transformed that into a simple JSON file with an example value and created a file that looked like this:
1
2
3
4
5
6
7
8
{
  "Subscription": "Prod-Shared-Subscription",
  "ResourceGroup": "rg-app-prod-weu",
  "VMName": "vm-app-prod-01",
  "Region": "westeurope",
  "Environment": "Prod",
  "TimeGenerated": "2025-01-14T10:32:45.123Z"
}
- Save that as .txt file and upload it. You should get the result similar to this:
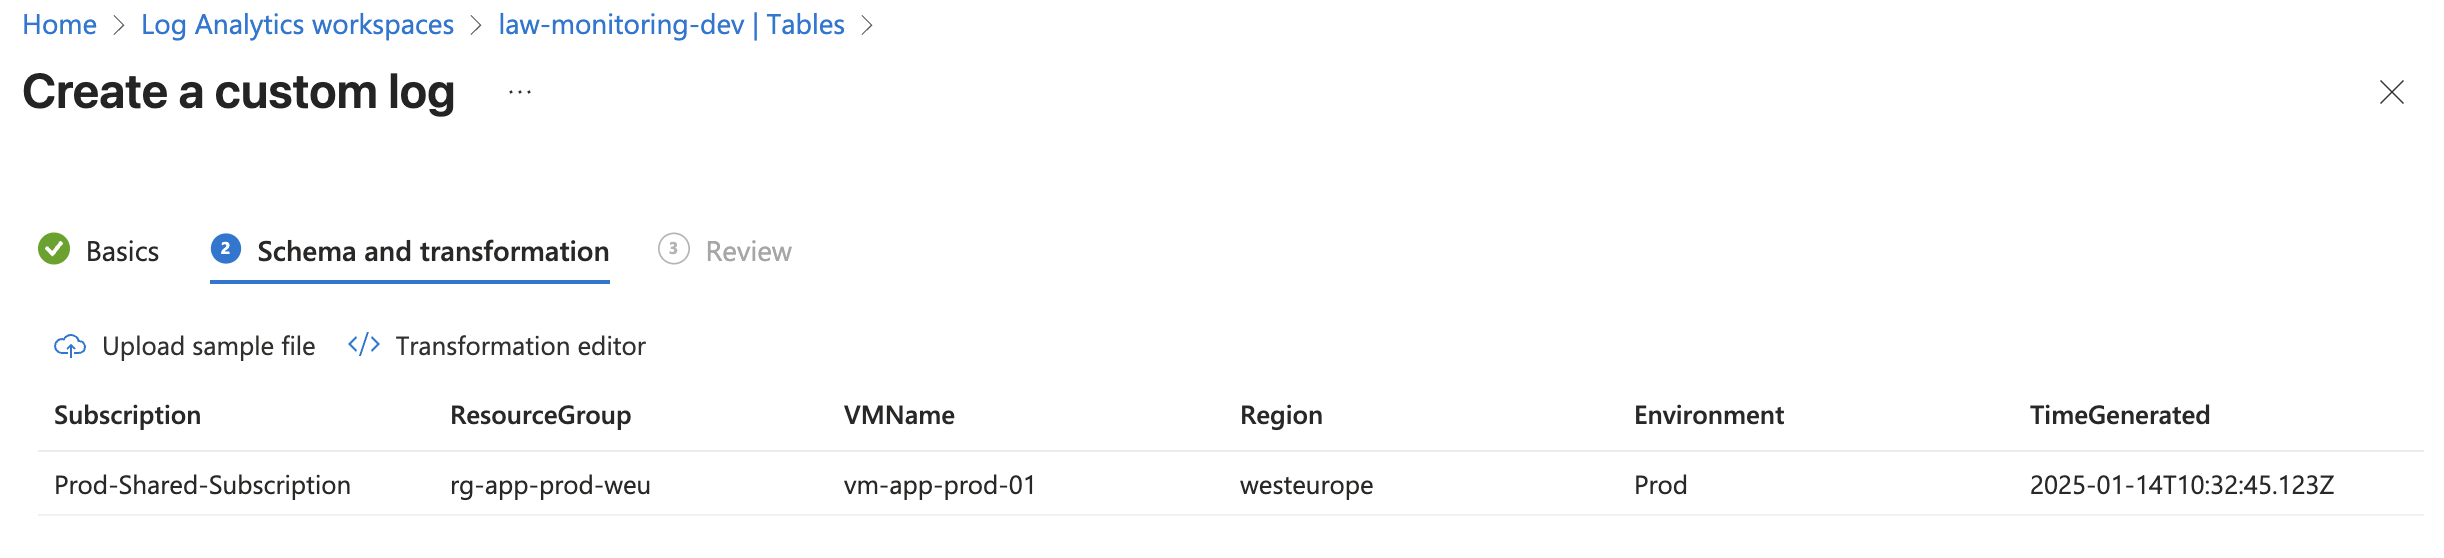
As you can see, our table and DCR correctly recognized the file structure and table format.
Click Create to finish creating the table and Data Collection Rule.
Validate that table and DRC were created. Note the table name as _CL at the end.
Data collection and Ingestion
With your Log Analytics workspace, DCE, and DCR ready, we have a place to store and access our data. It’s time to automate the data push using Azure Automation.
We’ll walk through:
- Creating or using an existing Automation Account
- Creating a runbook and scheduling it
- Assigning permissions to the Managed Identity
- Explaining what the script does
Step 4: Create Automation Account
- Go to the Azure Portal
- Search for “Automation Accounts”
- Click + Create or select an existing one
- Choose:
- Resource Group: Use the same one as your workspace if possible
- Name: e.g.
aa-custom-monitoring - Region: Match your LAW/DCE region
- Click Review + Create → Create
Step 5: Configure permissions
To ensure that our automation account can push data into LAW, we need to configure specific permissions.
- Go to the Automation Account → Identity
- Enable System Assigned Managed Identity
- Then assign the following roles:
| Scope | Role | Purpose |
|---|---|---|
| Subscription (all VMs) | Reader | To read VM metadata |
| Log Analytics Workspace | Log Analytics Contributor | To write custom data |
| Log Analytics Workspace | Monitoring Metrics Publisher | Required for ingestion via DCR |
You can assign these roles in Access Control (IAM) from the Portal, or use New-AzRoleAssignment in PowerShell.
Step 6: Create custom PowerShell Runbook
- Open your Automation Account
- Go to Runbooks → + Create a runbook
- Name it (e.g.
Push-VM-Tags-To-LAW) - Type: PowerShell
- Runtime: 5.1 or 7.2, depending on your script requirements. The example script below works best with version 7.2
- Paste your PowerShell script into the editor
Here is the PowerShell script:
You will need to create to fill in the following variables/parameters:
- Region
- That DCE Log Ingestion URI that we grabbed eaerlier
- Workstream name is a table name, with prefis “Custom-“. Also do not forget to include _CL at the end. In my example that is
Custom-Custom_VMTags_CL - DCR Immutable ID. You can find it on the Overview page or grab it via PowerShell
# Get the DCR object $dcr = Get-AzDataCollectionRule -ResourceGroupName $resourceGroupName -Name $dcrName # Output the Immutable ID and copy it to Clipboard $dcr.ImmutableId | clip - Save your Runbook and publish it
- You can also create a schedule or a different trigger for it, based on your needs
The script will do the following:
Here’s what your script should be doing under the hood:
- Authenticates using the Automation Account’s managed identity
- Loops through all subscriptions
- Finds all VMs in a target region
- Collects the
Environmenttag and other info - Builds a JSON array of results
- Sends it to the DCE endpoint, using
Invoke-RestMethodwith proper headers - Data lands in the custom table defined by the DCR
Validate Data Ingestion
Once your script runs successfully, let’s check if the data actually landed in Log Analytics.
View data with a simple KQL query
- Go to your Log Analytics Workspace in the Azure Portal
- Click on Logs
- Run the following query using your custom table name (e.g.
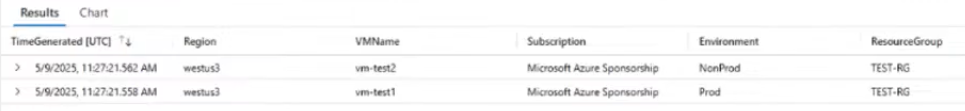
Custom_VMTags_CL):
Custom_VMTags_CL | order by TimeGenerated desc You should see your collected data: VM name, subscription, region, environment tag, and timestamp.
It can take up to 15 minutes before you are able to see your data after first ingestion. If no data appears after that:
- Double-check that your runbook ran without errors
- Make sure the DCE URL and DCR Immutable ID were correct
- Validate permissions on the Automation Account’s managed identity
Combine custom data with existing VM Insights
If VM Insights is enabled for your VMs, you can now combine your custom tag data with performance metrics like disk space.
Run this query:
>InsightsMetrics | where TimeGenerated > ago(1h) | where Name == "FreeSpaceMB" | extend VMName = tostring(Computer) | join kind=inner Custom_VMTags_CL on VMName | where Environment =~ "Prod" The result should return all the information from VM Insights, but only for VMs with Environment Tag value set to Prod.
This lets you filter metrics like disk space, CPU, or memory by something that doesn’t exist in Insights by default—like the Environment tag.
Now that you have that, you can easily setup Azure Monitor Alerts specifically for Prod VMs.
As you could see, tracking what Azure doesn’t log out-of-the-box doesn’t have to be hard.
By using a few native services—Log Analytics, Automation, Data Collection Endpoint, and Data Collection Rule. You can push exactly the data you care about into your monitoring pipeline. This setup is lightweight, flexible, and reusable. You can adapt it to nearly any custom use case in your cloud or hybrid environment.
I hope this was useful. Keep exploring and keep clouding around.
Vukasin Terzic