
This article is part of the Festive Tech Calendar 2024, and fun fact—it’s a bit nostalgic for me! My very first blog post on this page ago was also part of this initiative. It feels great to continue the tradition. Stick around until the end for more about this amazing community-driven event.
What is Diagram as Code?
Diagram as Code is exactly what it sounds like—a way to create diagrams by writing code. No fiddling with drag-and-drop tools, no painstaking manual edits. Instead, you write your visuals into existence, making it easy to version control, automate, and reproduce your diagrams whenever needed.
Why is this useful? Imagine you’re documenting your Network setup or mapping out your Azure infrastructure. Sure, you could dump that information into a table or paragraph, but why not go the extra mile and present it visually? A well-placed diagram can make technical reports, IT documentation, and even presentations much more engaging and easier to understand.
My first encounter with diagramming through code was more than 20 years ago, writing in Pascal. Back then, I had to define every pixel or rely on ASCII art to make things work (and let me tell you, ASCII art is an acquired taste). Thankfully, we’ve come a long way since then. Today, we have powerful tools with modern syntax that handle the heavy lifting, letting us focus on the what instead of the how.
Diagram as Code Tools
Here are some diagram as code tools, that we can easily start utilizing:
PlantUML
PlantUML is one of the most versatile tools for Diagram as Code enthusiasts. It uses simple and readable plain text to generate a wide variety of diagrams. From UML (Unified Modeling Language) diagrams like class diagrams and sequence diagrams to more creative outputs such as Gantt charts and mind maps, PlantUML has got you covered.
What makes PlantUML particularly powerful is its flexibility and wide adoption in the developer and IT communities. It integrates seamlessly with many tools like Visual Studio Code, IntelliJ, and even CI/CD pipelines. You can include diagrams in your documentation, export them to various formats (PNG, SVG, or even plain text), and easily version control them along with your codebase.
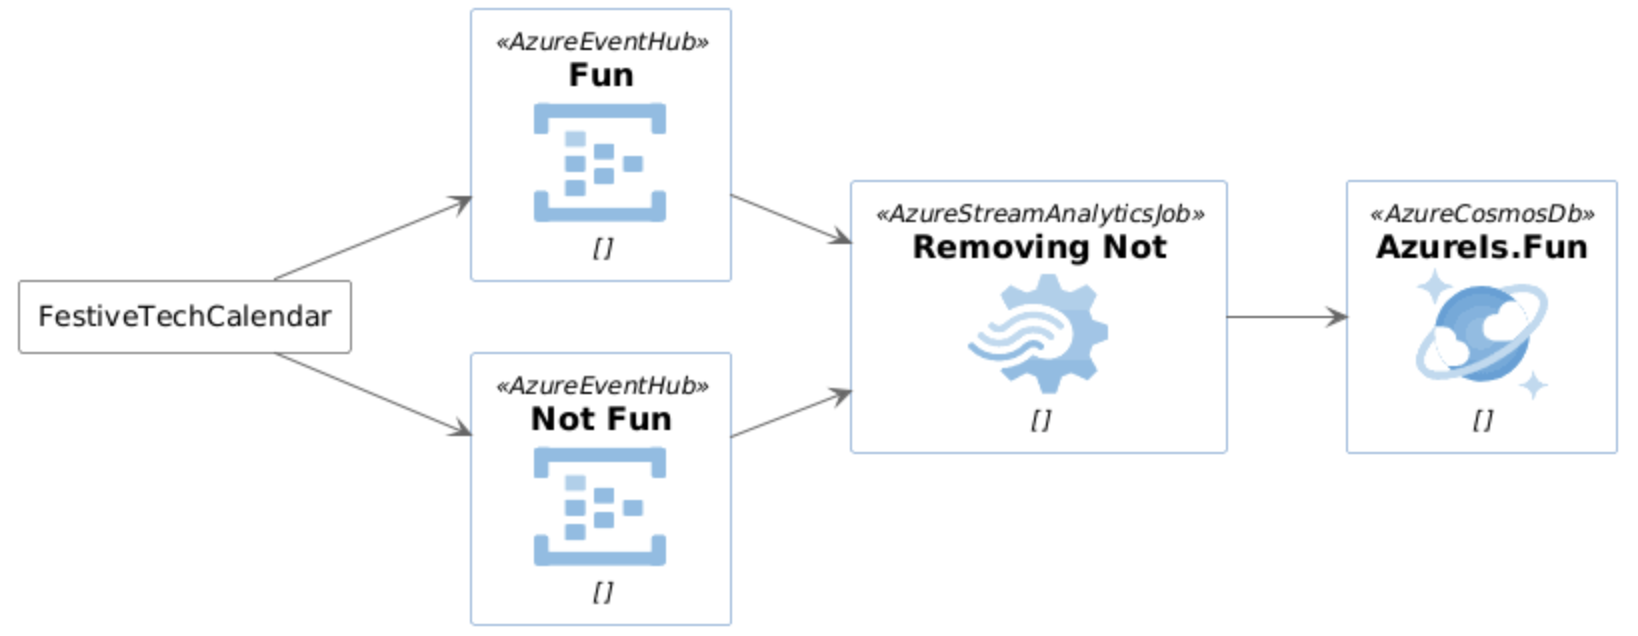
Great thing about PlantUML is that is also contains Azure Symbols.
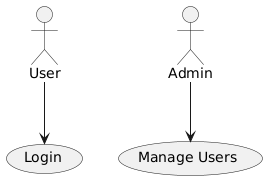
Here is an example of PlantUML:
1
2
3
4
5
6
@startuml
actor User
actor Admin
User --> (Login)
Admin --> (Manage Users)
@enduml
Mermaid
Mermaid is a fantastic Diagram as Code tool that combines simplicity with versatility. It allows you to define diagrams using a concise, readable syntax. From flowcharts and Gantt charts to entity-relationship diagrams, Mermaid supports a wide range of diagram types, making it a great tool for developers and IT professionals.
One of the key reasons I use Mermaid is its seamless integration with GitHub. Mermaid diagrams can be rendered directly in GitHub markdown files, which is a game-changer for creating visually rich documentation right inside your repositories. No extra tools or plugins needed—just write your diagram in markdown, and GitHub takes care of the rendering.
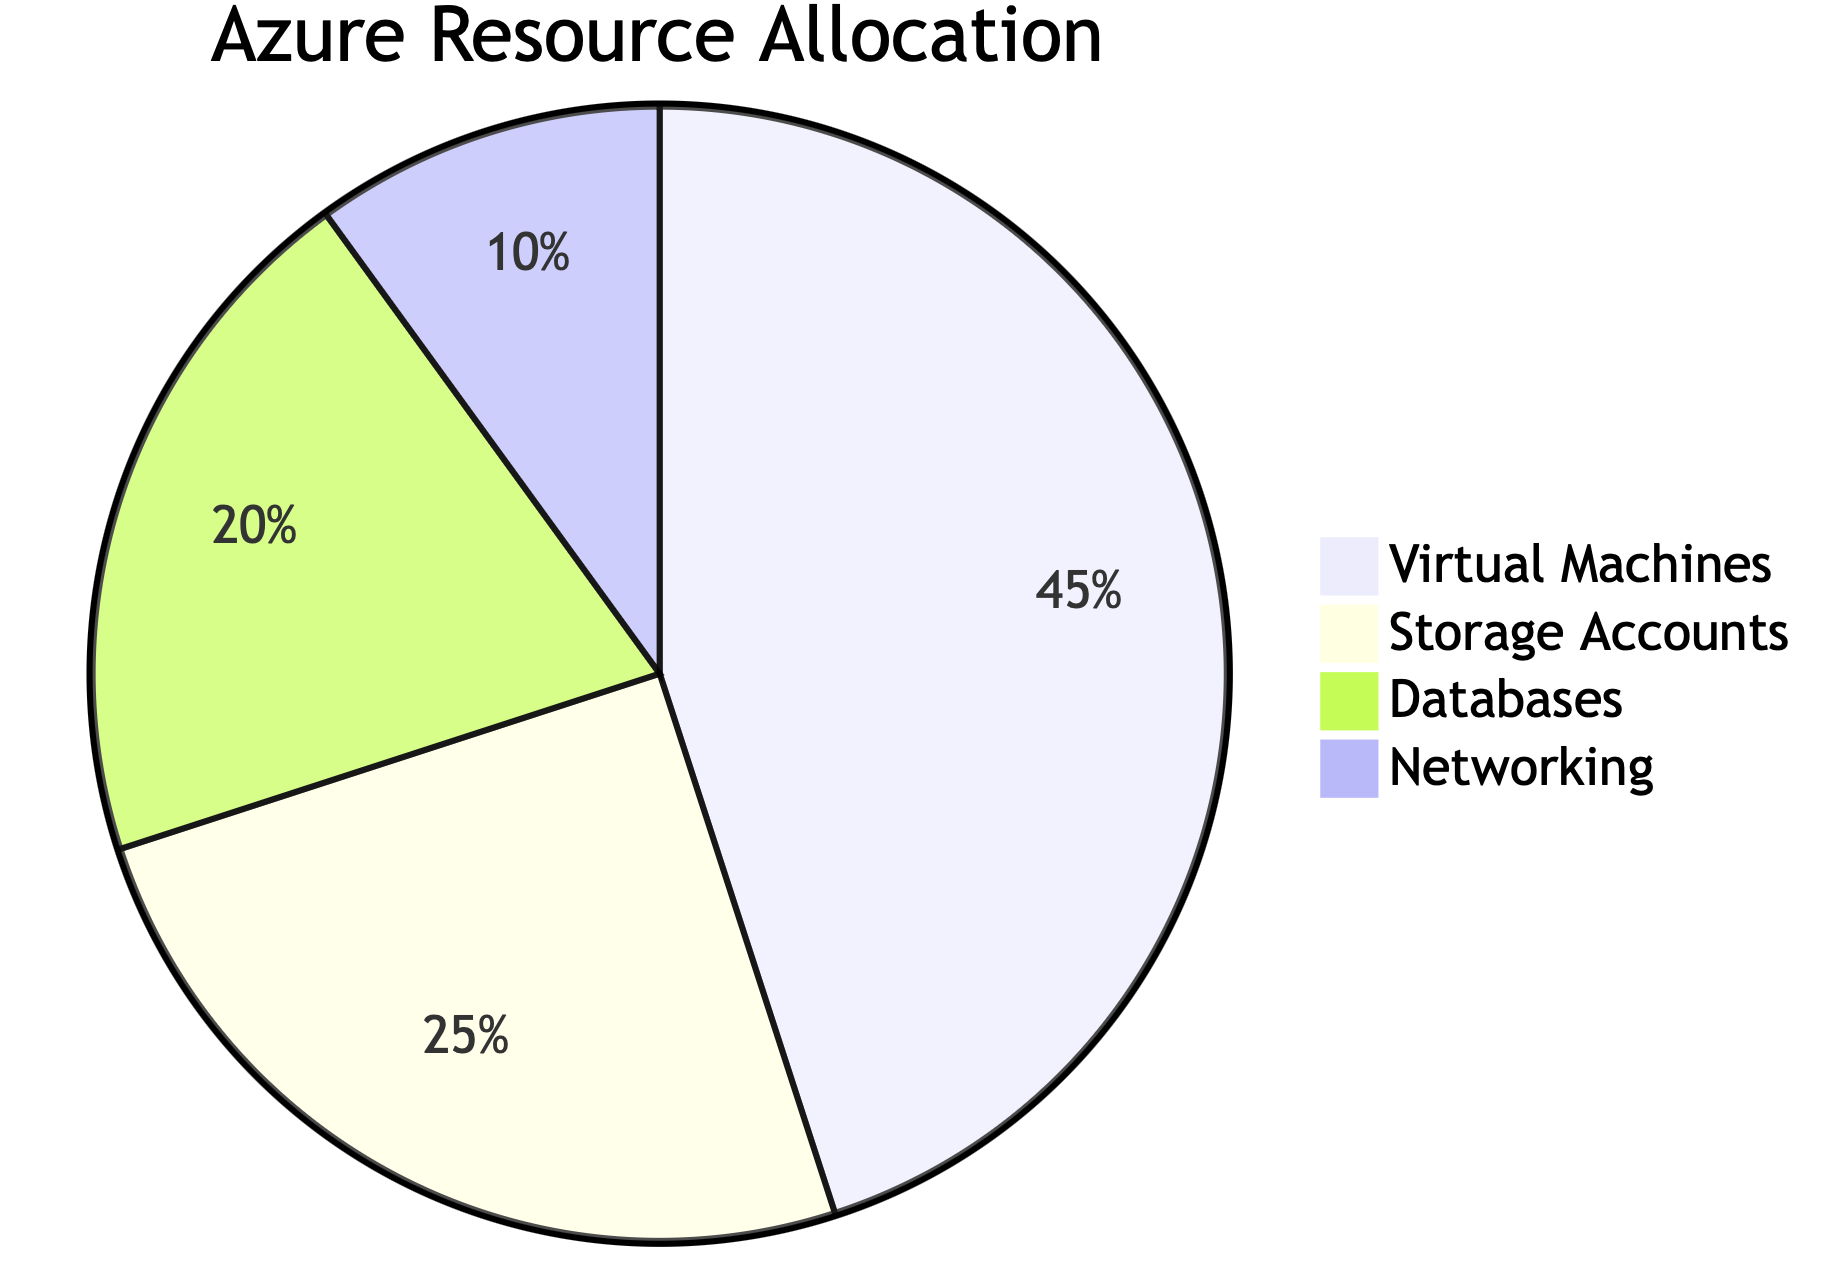
Here is an example of Pie Chart with Mermaid:
1
2
3
4
5
6
7
8

pie
    title Azure Resource Allocation
    "Virtual Machines": 45
    "Storage Accounts": 25
    "Databases": 20
    "Networking": 10
And here is the result:
GraphViz
Graphviz is a robust and versatile tool for creating structured graphs, making it a popular choice for network diagrams, dependency graphs, and hierarchical visualizations. It uses the DOT language, which is a simple text-based syntax to define nodes, edges, and attributes. Graphviz excels at rendering complex relationships in a clear and concise manner.
One of its biggest advantages is flexibility—you can fine-tune every aspect of your graph, from layout and colors to custom shapes and edge styles. While it requires a bit more effort than some other tools, it’s incredibly powerful for visually organizing complex systems.
I personally did not attempt to generate GraphViz automatically via PowerShell, but I often use it “manually”.
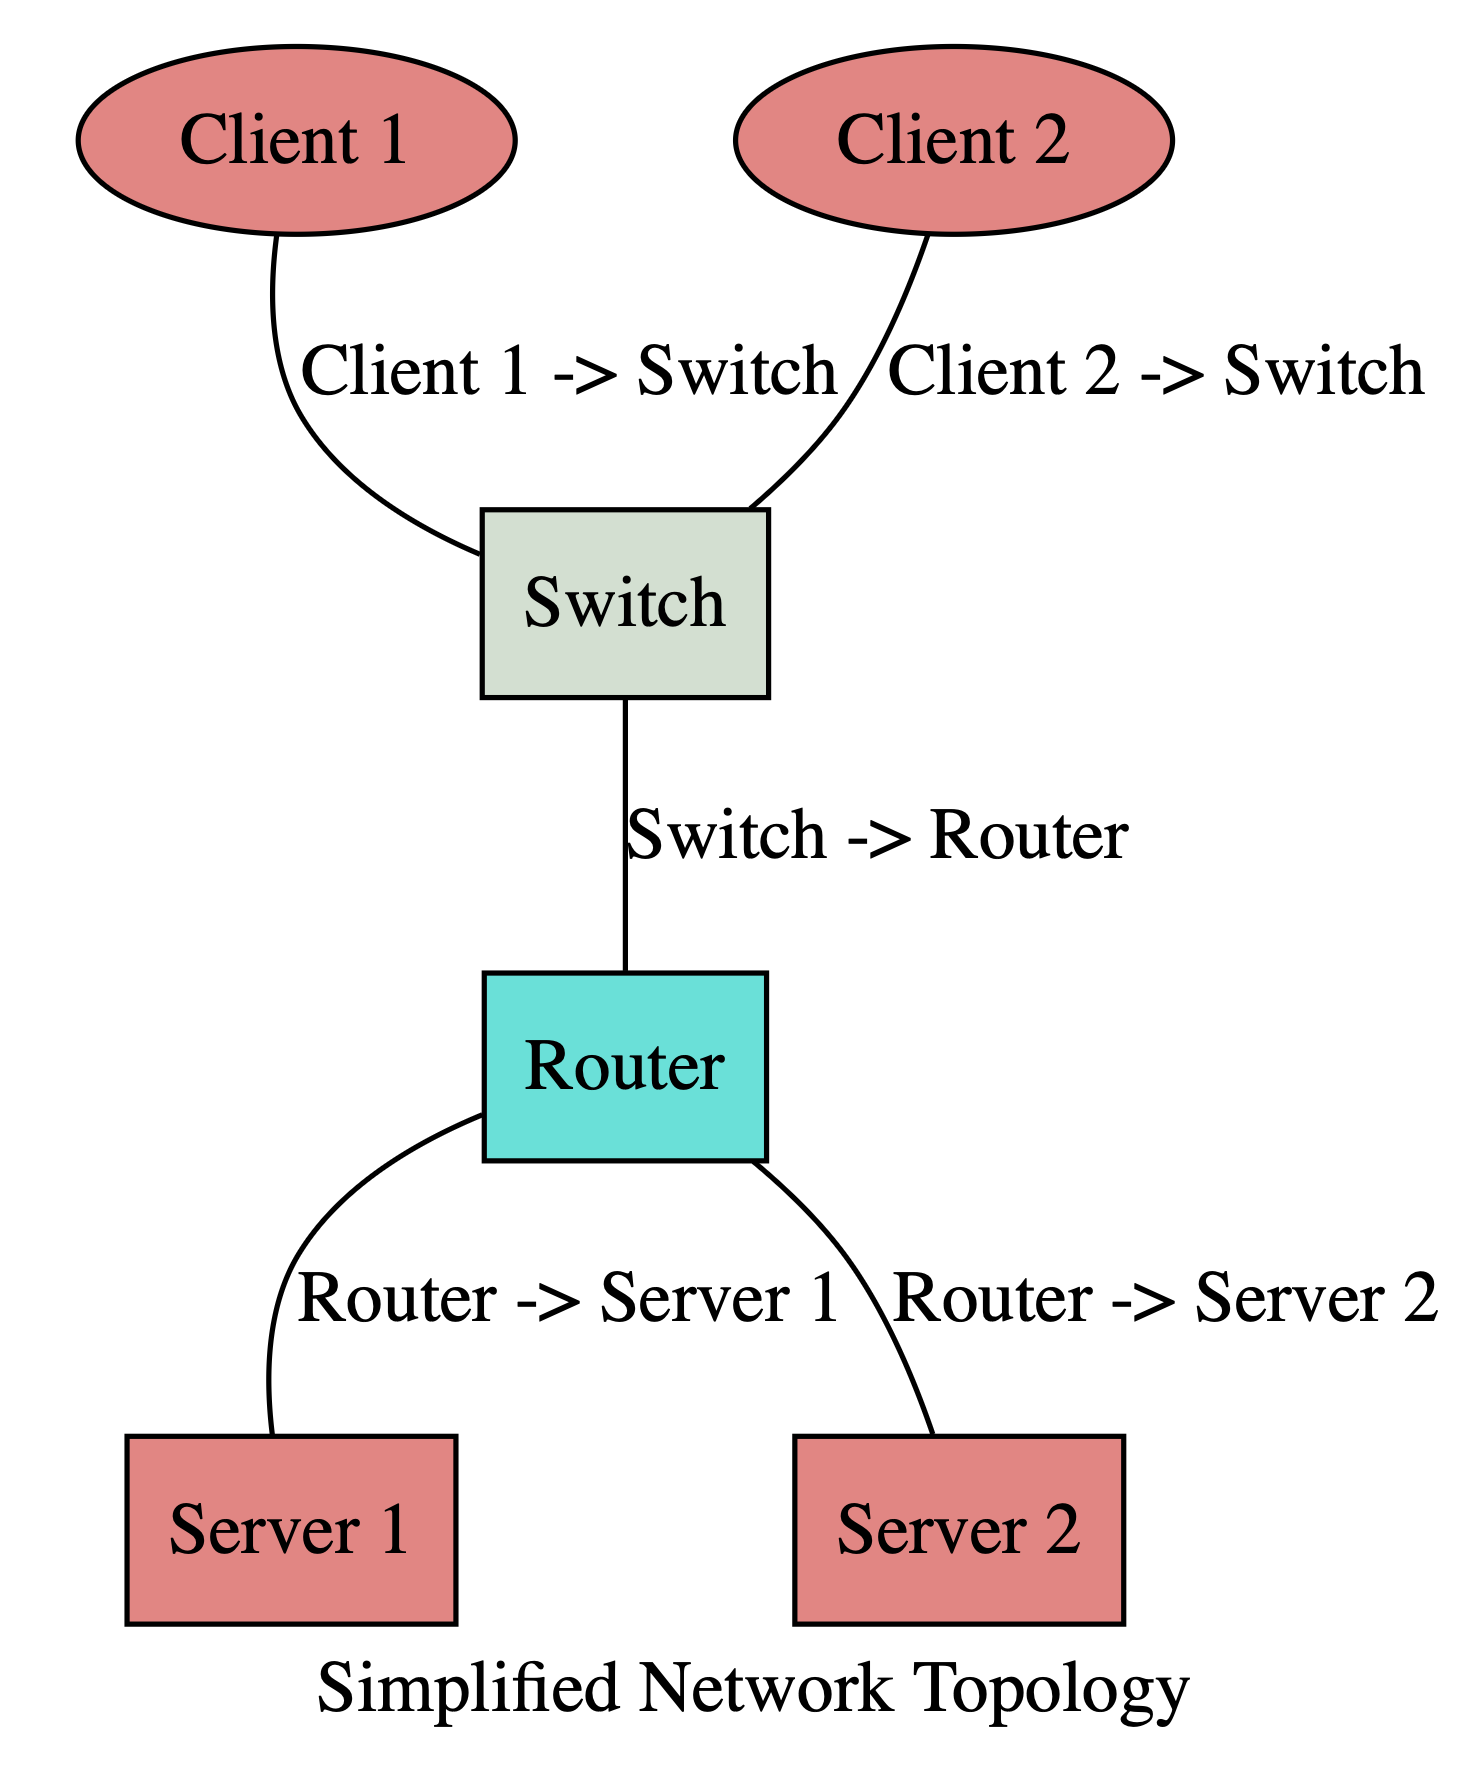
Here is an example of simplified network topology diagram:
1
2
3
4
5
6
7
8
9
10
11
12
13
14
15
16
17
18
19
20
21
22
23
24
25
26
27
28
29
30
31
32
33
34
35
36
37
38
39
40
41
42
43
44
45
46
47
48
49
graph NetworkTopology {
    label="Simplified Network Topology";

    # Nodes
    Client1 [
        shape=ellipse,
        label="Client 1",
        fillcolor="#f08080",
        style=filled,
    ];
    Client2 [
        shape=ellipse,
        label="Client 2",
        fillcolor="#f08080",
        style=filled,
    ];
    Switch [
        shape=rectangle,
        label="Switch",
        fillcolor="#d0e0d0",
        style=filled,
    ];
    Router [
        shape=rectangle,
        label="Router",
        fillcolor="#19e3d9",
        style=filled,
    ];
    Server1 [
        shape=rectangle,
        label="Server 1",
        fillcolor="#f08080",
        style=filled,
    ];
    Server2 [
        shape=rectangle,
        label="Server 2",
        fillcolor="#f08080",
        style=filled,
    ];

    # Connections
    Client1 -- Switch [label="Client 1 -> Switch"];
    Client2 -- Switch [label="Client 2 -> Switch"];
    Switch -- Router [label="Switch -> Router"];
    Router -- Server1 [label="Router -> Server 1"];
    Router -- Server2 [label="Router -> Server 2"];
}
And the result looks good:
Automatically generate Diagram as Code
Manually creating diagrams for complex systems like Azure environments can be time-consuming and prone to errors. Instead of crafting every diagram by hand, we can automate the process using scripting. We can dynamically generate Diagram as Code syntax and add values we need we want.
Visualizing Azure Resource Hierarchy with Mermaid Diagrams and PowerShell
In this example, we will use PowerShell and Mermaid diagrams to generate Azure Resource Hierarchy structure in form of a flow chart.
Mermaid Syntax
First, let’s learn the syntax for the Mermaid flowchart:
1
2
3
4
5
6
7
8
9
#Top->Down
   graph TD
       A[Start] --> B{Decision}
       B -->|Yes| C[Action 1]
       B -->|No| D[Action 2]

# Left->Right
    graph LR
        WebApp[Web App] --> Database[(Database)]
And here is how that looks like:
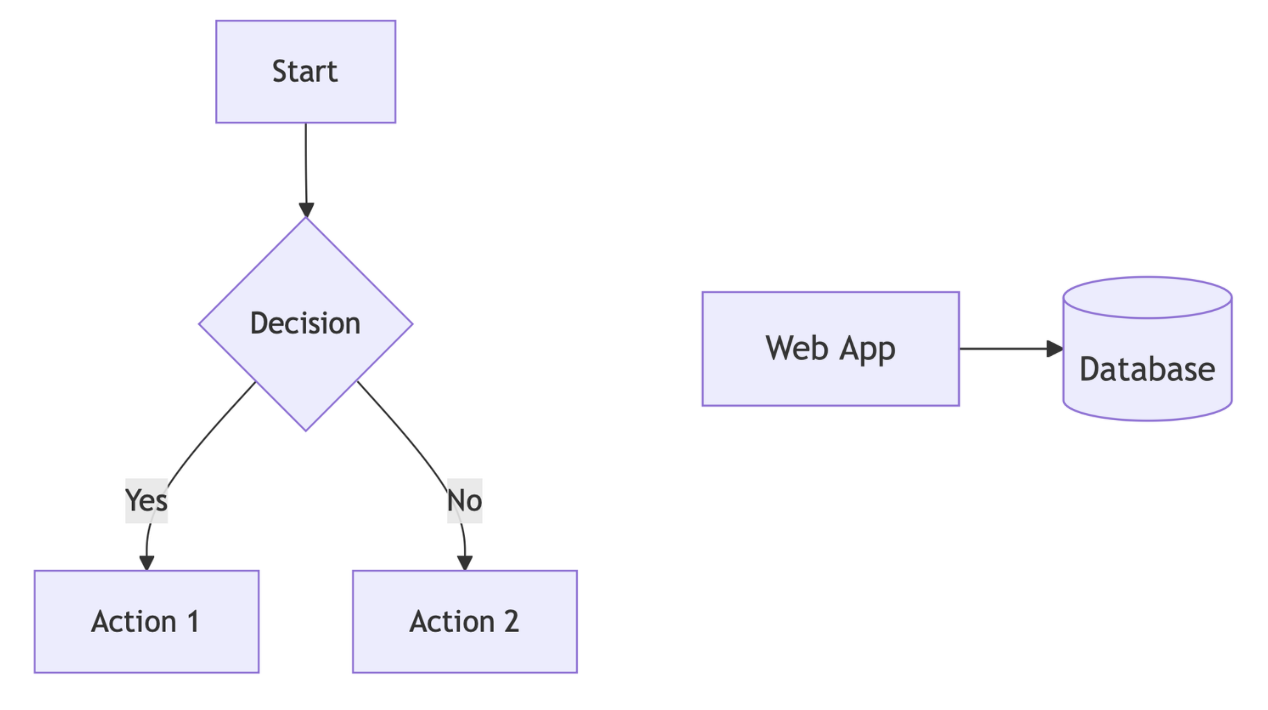
As you can see, this is simple to follow. We will need to create something like this:
1
2
3
4
graph TD;
    TenantRootGroup(Tenant Root Group)-->MG-Dev(MG-Dev);
    TenantRootGroup(Tenant Root Group)-->Pay-As-You-Go[Pay-As-You-Go];
    MG-Dev(MG-Dev)-->MicrosoftAzureSponsorship[Microsoft Azure Sponsorship];
and get hierarchy similar to this:
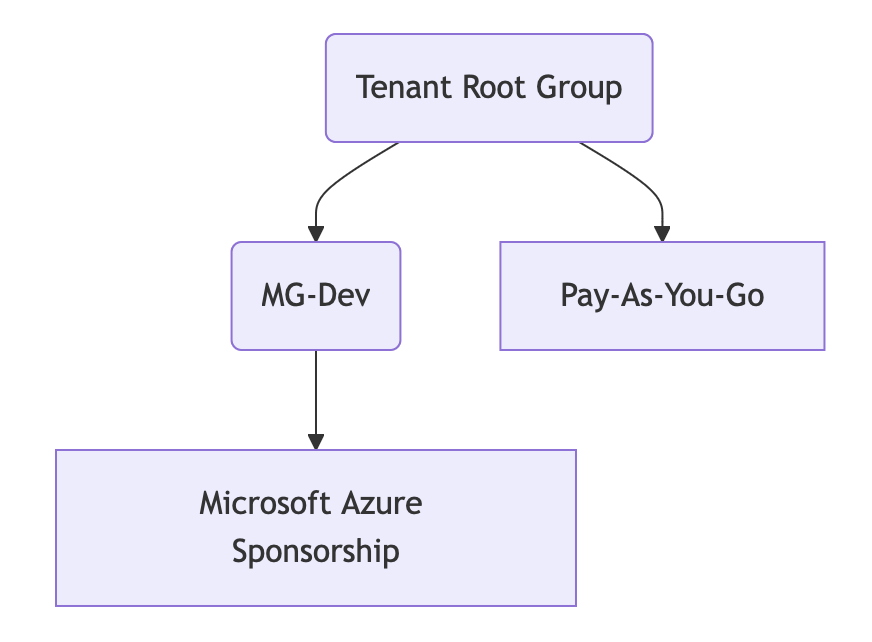
Notice how boxes for Management Groups and Subscriptions look different for easier visual recognition.
Getting Information from Azure
Let’s get that information from our Azure first:
Management Group Hierarchy:
1
2
3
4

#Get full Management Groups and Subscription Hierarchy
$resourceHierarchy = Get-AzManagementGroupEntity
Generate Mermaid Flowchart with PowerShell
Now that we have that, let’s generate GitHub Compatible markdown with full resource group hierarchy:
1
2
3
4
5
6
7
8
9
10
11
12
13
14
15
16
17
18
19
20
21
22
23
24

$mermaid = "graph TD;"
    foreach ($entity in $resourceHierarchy) {
        if ($entity.Parent) {
            $parentEntity = $entities | Where-Object {$_.Id -eq $entity.Parent}
            $parentName = $parentEntity.DisplayName
            if ($parentName) {
                $childName = $entity.DisplayName.Replace(" ", "")
                $parentName = $parentName.Replace(" ", "")
                if ($entity.Type -eq "Microsoft.Management/managementGroups") {
                    $childName = $childName + "(" + $entity.DisplayName + ")"
                } elseif ($entity.Type -eq "/subscriptions") {
                    $childName = $childName + "[" + $entity.DisplayName + "]"
                }
                if ($parentEntity.Type -eq "Microsoft.Management/managementGroups") {
                    $parentName = $parentName + "(" + $parentEntity.DisplayName + ")"
                } elseif ($parentEntity.Type -eq "/subscriptions") {
                    $parentName = $parentName + "[" + $parentEntity.DisplayName + "]"
                }
                $mermaid += " `n    " + $parentName + "-->" + $childName + ";"
            }
        }
    }
    return $mermaid
I run this in Enterprise Landing Zone and here is how it looks like:

Now let’s generate that same thing, but for hierarchy of a single resource instead of full resource organization hierarchy from previous example.
1
2
3
4
5
6
7
8
9
10
11
12
13
14
15
16
17
18
19
20
21
22
23
24
25
26
27
28

#If we want to get Hierarchy only for specific Subscription, we can do the following:

#Get full Management Groups and Subscription Hierarchy
$resourceHierarchy = Get-AzManagementGroupEntity

$subscriptionId = "yourSubId"
$subName = (Get-AzSubscription -Subscriptionid $subscriptionId).Name

Set-AzContext -SubscriptionId $subscriptionId

$VM = Get-AzVM -ResourceGroupName "RG1" -Name "VM1"


#Filter resourceHierarchy to single Subscription

$filteredHierarchy = $resourceHierarchy | Where-Object {
                    $_.Type -eq '/subscriptions' -and $_.Name -eq $subscriptionId
                }

# This will contain all Management Groups in order only for the provided Subscription:

$managementGroups = $filteredHierarchy.ParentDisplayNameChain


#Now we need to append the Subscription, RG and VM to the chain
$fullHierarchy = $filteredHierarchy + $subName + $VM.ResourceGroupName + $VM.Name
We should have a full resource hierarchy of the provided VM. Now let’s generate Mermaid code for it:
1
2
3
4
5
6
7
8
9
10
11
12
13
14
15
16
17
18
19
20
21
22
23
24
25
26
27
28
29
30
31
32
33
34
35
36
37
38
39
40
41
42
43
44
45
46
47
48
49
50

 $mermaidCode = "graph TD;"
            for ($i = 0; $i -lt $fullHierarchy.Count - 1; $i++) {

                $parent = $null
                $child = $null

                $idParent = $fullHierarchy[$i].Replace(" ", "")
                $idChild = $fullHierarchy[$i + 1].Replace(" ", "")


                if (($fullHierarchy[$i] -eq $vmData.Subscription) -and ($fullHierarchy[$i + 1] -eq $vmData.Subscription)) {

                    #Special use case, when $i is Management Group, and $i + 1 is also Subscription with the same name
                    $parent = $idParent + " + $fullHierarchy[$i] + " # This is Management Group
                    $child = $idChild + "SUB" + "(" + $vmData.Subscription + "<br>Subscription" + ")" # This is Subscription

                } elseif (($fullHierarchy[$i] -eq $vmData.Subscription) -and ($fullHierarchy[$i + 1] -ne $vmData.Subscription)) {

                    $parent = $idParent + "SUB" + "(" + $vmData.Subscription + "<br>Subscription" + ")" # This is Subscription
                    $child = $idChild + "([" + $fullHierarchy[$i + 1] + "<br>Resource Group" + "])" # This is Resource Group


                } elseif ($fullHierarchy[$i] -eq $vmData.ResourceGroup) {

                    $parent = $idParent + "([" + $vmData.ResourceGroup + "<br>Resource Group" + "])" # This is Resource Group
                    $child = $idChild + "[[" + $fullHierarchy[$i + 1] + "]]" # This is VM

                } else {

                    $parent = $idParent + " + $fullHierarchy[$i] + " # This is Management Group

                    if ($fullHierarchy[$i] -eq $fullHierarchy[$i + 1]) {

                        # Special case: when management group and subscription have the same name, treat $i as management group and $i + 1 as subscription
                        $child = $idChild + "SUB" + "(" + $vmData.Subscription + "<br>Subscription" + ")" # Assume second is subscription

                    } elseif ($fullHierarchy[$i + 1] -eq $vmData.Subscription) {

                        $child = $idChild + "SUB" + "(" + $vmData.Subscription + "<br>Subscription" + ")" # This is Subscription

                    } else {
                        $child = $idChild + " + $fullHierarchy[$i + 1]  + " # This is Management Group
                    }
                }

                $mermaidCode +=  " `n    " + $parent + " --> " + $child + ";"

            }
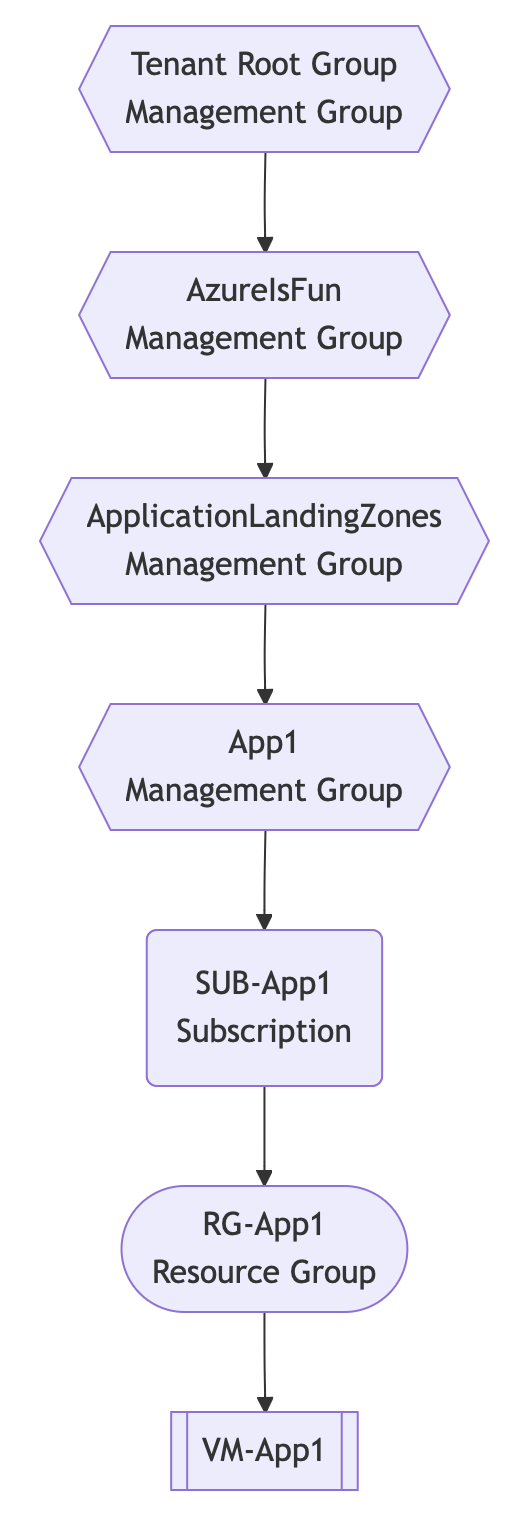
Feel free to tweak the box types and styles. Here is the result I got:
1
2
3
4
5
6
7
    graph TD;
        TenantRootGroup --> AzureIsFun;
        AzureIsFun --> ApplicationLandingZones;
        ApplicationLandingZones --> App1;
        App1 --> SUB-App1(SUB-App1<br>Subscription);
        SUB-App1(SUB-App1<br>Subscription) --> RG-App1([RG-App1<br>Resource Group]);
        RG-App1([RG-App1<br>Resource Group]) --> VM-App1[[VM-App1]];
And here is how it looks like:
Mermaid in Markdown on GitHub
Now you just need to embed displayed code in your GitHub mermaid code block and commit the file. GitHub will take care of the rest.
Mermaid in HTML
As I mentioned before, you can also embed Mermaid into HTML websites.
The same Mermaid syntax will work in both, Markdown and HTML. Instead of embedding it in codeblock, in HTML you just need to place it somewhere in <body>, for example in it’s own <div>.
Additional requirement is to include JavaScript.
1
2
3
4
5

    <script type="module">
        import mermaid from 'https://cdn.jsdelivr.net/npm/mermaid@11/dist/mermaid.esm.min.mjs';
    </script>
Festive Tech Calendar 2024
This article is part of the Festive Tech Calendar 2024, an annual event bringing the tech community together to share knowledge and celebrate innovation. Visit the Festive Tech Calendar for more articles, videos, and fun events.
Happy Holidays and keep clouding around.
Vukasin Terzic
